- Home
- :
- All Communities
- :
- Products
- :
- ArcGIS Online
- :
- ArcGIS Online Questions
- :
- How to obscure point data
- Subscribe to RSS Feed
- Mark Topic as New
- Mark Topic as Read
- Float this Topic for Current User
- Bookmark
- Subscribe
- Mute
- Printer Friendly Page
- Mark as New
- Bookmark
- Subscribe
- Mute
- Subscribe to RSS Feed
- Permalink
I have a point data layer in AGOL that was created from an excel file. I am wondering if there is a way to effectively obscure the exact locations of the points for the privacy of the data? Are there any tools in AGOL or desktop that would allow us to 1.) keep each individual point in the data set (so aggregation is not an obscuration option) and 2.) obscure the exact location by generalizing the location?
Solved! Go to Solution.
Accepted Solutions
- Mark as New
- Bookmark
- Subscribe
- Mute
- Subscribe to RSS Feed
- Permalink
In the excel file, you could add a column of random numbers between 0 and 1, then if your coordinates are in decimal degrees, you could calculate 2 new long/lat columns with
1/scale subrtracted from the initial values. What I mean by 'scale' is you wouldn't want to subtract 0.8, for instance, from the values, since it would move the features too far. try
1/10000 or something so you are only shifting the 4th or 5th or 6th decimal place a smidge.
My preference for complete anonymity is to subtract some portion longitude from the input values so that it places the coordinates in the Atlantic Ocean at the same latitudinal band as the input data. This preserves the interpoint spacing but messes with the actual location.
There are lots of ways to preserve the point spacing and move them to another location on Earth... and even off planet if you need to.
Of course if you want a basemap, then simply moving the points suggests that the observations are at that location... this brings in a whole new set of problems.
- Mark as New
- Bookmark
- Subscribe
- Mute
- Subscribe to RSS Feed
- Permalink
So you are talking about something more than using a big marker or randomly shuffling the points (which would move the issue to another location which isn't best).
What do envision it to be like ? a raster? a hotspot?
- Mark as New
- Bookmark
- Subscribe
- Mute
- Subscribe to RSS Feed
- Permalink
Hi Dan, actually I would prefer it to be randomly shuffled to another location (not super far, say within 10 km). Ideally it would still be a vector point location, just not at the actual latitude and longitude where it was GPSed.
- Mark as New
- Bookmark
- Subscribe
- Mute
- Subscribe to RSS Feed
- Permalink
In the excel file, you could add a column of random numbers between 0 and 1, then if your coordinates are in decimal degrees, you could calculate 2 new long/lat columns with
1/scale subrtracted from the initial values. What I mean by 'scale' is you wouldn't want to subtract 0.8, for instance, from the values, since it would move the features too far. try
1/10000 or something so you are only shifting the 4th or 5th or 6th decimal place a smidge.
My preference for complete anonymity is to subtract some portion longitude from the input values so that it places the coordinates in the Atlantic Ocean at the same latitudinal band as the input data. This preserves the interpoint spacing but messes with the actual location.
There are lots of ways to preserve the point spacing and move them to another location on Earth... and even off planet if you need to.
Of course if you want a basemap, then simply moving the points suggests that the observations are at that location... this brings in a whole new set of problems.
- Mark as New
- Bookmark
- Subscribe
- Mute
- Subscribe to RSS Feed
- Permalink
Thanks Dan Patterson for the brain share- I am currently trialing to see which way will be the best fit for this project. I think your way directly from the excel file is certainly the most efficient. I've also received advice to do the extra step in desktop running a buffer and then generating random point within the buffer- granted this adds a few extra steps...
Thanks again!
- Mark as New
- Bookmark
- Subscribe
- Mute
- Subscribe to RSS Feed
- Permalink
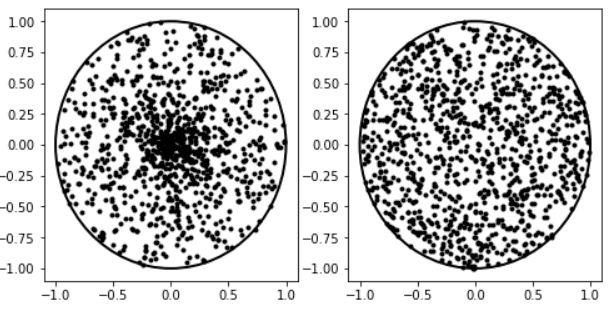
Here's a Python implementation you can tailor to Excel (mostly just need r2, t2, x2, y2). Note the difference between square-rooting the radius (right) and not (left):
import matplotlib.pyplot as plt
from matplotlib.patches import Circle
import numpy as np
r1 = np.random.rand(1000)
t1 = np.random.rand(1000) * np.pi * 2.0
x1 = r1 * np.cos(t1)
y1 = r1 * np.sin(t1)
r2 = np.sqrt(np.random.rand(1000))
t2 = np.random.rand(1000) * np.pi * 2.0
x2 = r2 * np.cos(t2)
y2 = r2 * np.sin(t2)
plt.figure(figsize=(8, 4))
ax1 = plt.subplot(121)
circle = Circle((0, 0), 1, facecolor='none',
edgecolor=(0, 0, 0), linewidth=2, alpha=1)
ax1.add_patch(circle)
plt.plot(x1, y1, '.', color=(0, 0, 0), alpha=1)
ax2 = plt.subplot(122)
circle = Circle((0, 0), 1, facecolor='none',
edgecolor=(0, 0, 0), linewidth=2, alpha=1)
ax2.add_patch(circle)
plt.plot(x2, y2, '.', color=(0, 0, 0), alpha=1)
- Mark as New
- Bookmark
- Subscribe
- Mute
- Subscribe to RSS Feed
- Permalink
Hi Ahna,
Are you looking to maintain the spatial relationships between the data or just find a way to display the data? Are you able to generically share what the data is?
This is a topic that comes up a lot during our upcoming health conference. Here is a link in case this is of interest: http://www.esri.com/events/health
-Kelly
- Mark as New
- Bookmark
- Subscribe
- Mute
- Subscribe to RSS Feed
- Permalink
Thanks for the response Kelly! We don't necessarily need to maintain the spatial relationships between the data in the same way that public health does for analysis purposes, but it is certainly helpful to keep some amount of data integrity moving forward with the project. And to answer your question, the data is private water well information. When presenting this information in a water management tool to others, we would want to obscure the exact location of private wells.
Thanks for the link on the event as well!
- Mark as New
- Bookmark
- Subscribe
- Mute
- Subscribe to RSS Feed
- Permalink
We also have this question - I'd love to be able to obscure point data, but the way our organization does it is to simply round decimal degrees to 3 decimal places.