- Home
- :
- All Communities
- :
- Products
- :
- ArcGIS Online
- :
- ArcGIS Online Questions
- :
- Election Mapping - How to calculate and display To...
- Subscribe to RSS Feed
- Mark Topic as New
- Mark Topic as Read
- Float this Topic for Current User
- Bookmark
- Subscribe
- Mute
- Printer Friendly Page
Election Mapping - How to calculate and display Total Votes so far?
- Mark as New
- Bookmark
- Subscribe
- Mute
- Subscribe to RSS Feed
- Permalink
- Report Inappropriate Content
Hi all,
I’m reaching out for help on this. We have a very limited time frame to get this done, so any help you can give is greatly appreciated! There’s a bit to it, so I’m going to try to make this post easy to read.
Problem:
We’ve gotten the word that we need to be showing vote totals (for all reporting precincts) for each contest. Any idea how we do this?
What we need to include:
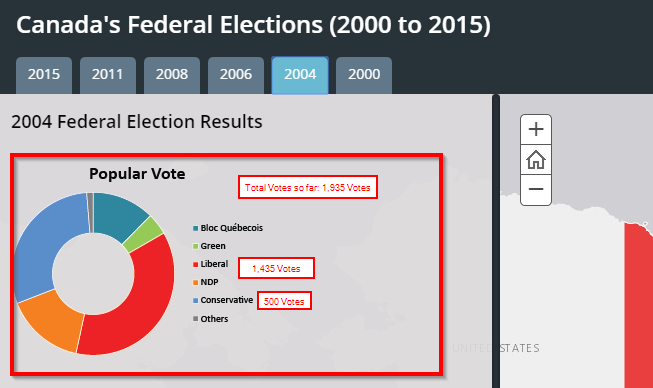
- Total votes so far
- Top vote-getter
- Preferably a chart showing vote totals for each candidate
Format:
I’m hoping to do this in the Map Series story map template, and would like it to be in the side panel if possible. See below for an example. We want this to update whenever we update the data.
Data structure:
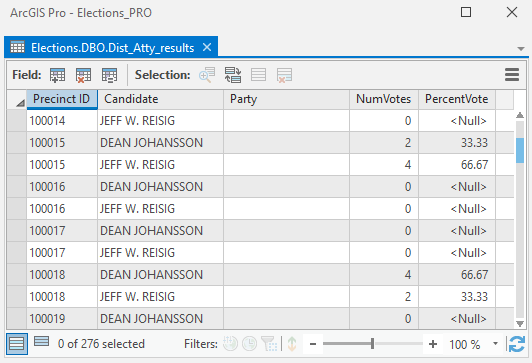
Below is our feature class table. We will have vote totals (Total Ballots field) coming in by precinct on election night, but currently we don’t have a field totaling those up.
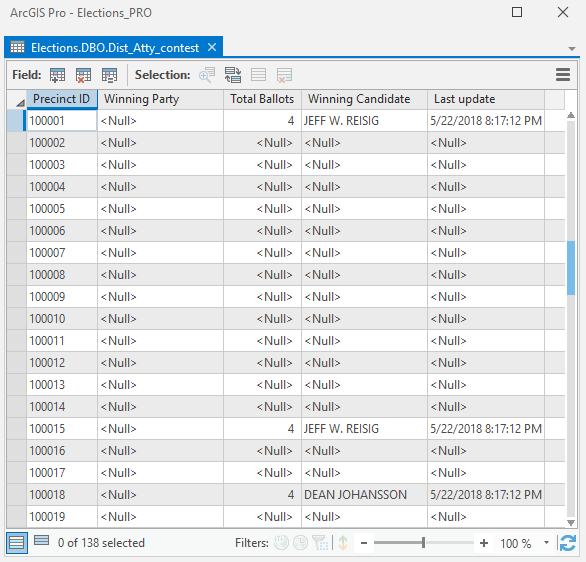
We also have a related table (see below) with totals for each precinct by candidate.
Solutions needed:
- A way to calculate or pass into the story map the vote totals for each candidate
- Is there a SUM operator somewhere in ArcGIS Online or Arcade that we could make use of?
- If we have to create new tables on the back end, what's the best way to do that and tie it in to the story map?
- Some method of displaying those totals in a chart or table, preferably in the side panel of the story map.
- A pie chart would be ideal, but a table or just dynamic text would work as well.
- We really want this to be dynamic; we don't want to have to update a static picture manually.
- Mark as New
- Bookmark
- Subscribe
- Mute
- Subscribe to RSS Feed
- Permalink
- Report Inappropriate Content
Hi Andrew,
Calculations and charting isn't built into Story Maps, but you can embed other applications that include such capabilities. I'd suggest taking a look at operations dashboard or the charting and summary widgets in web app builder.
Chart widget—Web AppBuilder for ArcGIS | ArcGIS
Info Summary widget—Web AppBuilder for ArcGIS | ArcGIS
-Kelly