- Home
- :
- All Communities
- :
- Products
- :
- ArcGIS Online
- :
- ArcGIS Online Questions
- :
- Arcade expression for alphanumeric value
- Subscribe to RSS Feed
- Mark Topic as New
- Mark Topic as Read
- Float this Topic for Current User
- Bookmark
- Subscribe
- Mute
- Printer Friendly Page
Arcade expression for alphanumeric value
- Mark as New
- Bookmark
- Subscribe
- Mute
- Subscribe to RSS Feed
- Permalink
I am creating a map showing different ratings for a feature. When data was collected rating was as below (an example).
00 : No defects
15 : 5 Minor defects
1A : More than 10 but less than 15 Minor defect
2A : More than 10 but less than 15 major defects
1B : more than 15 but less than 20 major defects
3C More than 20 but less than 25 significant defects
A represents values from 11-15
B represents values from 16-20
C represents values from 21-25
how do I create arcade expression to reflect alphanumeric as a numeric value to indicate the conditions where 3C>2A>1B>1A>15>00
thanks in advance
- Mark as New
- Bookmark
- Subscribe
- Mute
- Subscribe to RSS Feed
- Permalink
Hi [email protected]_stalbert ,
See below an example of an expression that will assign a numeric sequential value:
// read out rating code
var rating = $feature["Name of the field with the rating code"];
// dictionary with numeric values according to 3C>2A>1B>1A>15>00
var dct2 = {"00": 0, "15": 1, "1A": 2,
"1B": 3, "2A": 4, "3C": 5};
// check if rating is in dictionary and return the value
if (HasKey(dct2, rating)) {
return dct2[rating];
} else {
return -1;
}
You can change the values (0 to 5) in the dictionary defined on lines 5 and 6 with values representing a number in the range of the rating code if that is what you prefer. Is there are specific reason why you want the values to be numeric?
- Mark as New
- Bookmark
- Subscribe
- Mute
- Subscribe to RSS Feed
- Permalink
Thanks Xander
However I have more complex data for over thousands features eg:
- Mark as New
- Bookmark
- Subscribe
- Mute
- Subscribe to RSS Feed
- Permalink
I want the values be numeric (or treated as number) so higher the number most defective the features are and can be visualized in the map with different color
thanks
- Mark as New
- Bookmark
- Subscribe
- Mute
- Subscribe to RSS Feed
- Permalink
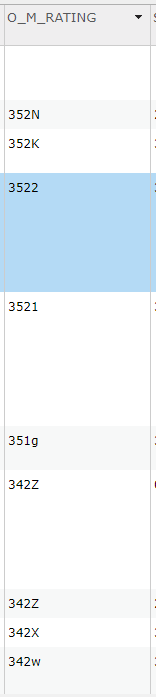
The rating you gave an example of and the o_m_rating pictured don't align.
- Mark as New
- Bookmark
- Subscribe
- Mute
- Subscribe to RSS Feed
- Permalink
Hi Khem Aryal ,
From the information you provided in the original post and screen shot you provided after this, I see two complete distinct things. Can you explain how the values ("352N", "3522", "342Z", etc) should be interpreted? I am sure something must be possible, but in order to help you further I need to understand how to interpret every possible value (and not just a subset of them).
- Mark as New
- Bookmark
- Subscribe
- Mute
- Subscribe to RSS Feed
- Permalink
My apology not describing the whole scenario.
These are the pipe inspection rating
where first letter indicates severity of defects (1-5) 1 being the least severe 5 being the most severe
second letter indicates the numbers of those most severe defects where more than 10 is A, more than 15 is B and so on
Third letter indicates the second-most severe defect (1-5) and last letter indicates the numbers of those second-most severe defects as more than 10 is A and more than 15 is B and so on
this rating is auto generated in the inspection software
for example
5J3B
means the pipe has 50 (J) of 5 rated severe defects and 15(B) of 3 rated severe defects.
similarly
352N means
the pipe has 5 of 3 rated defects and 70(N) of 2 rated defects
(again each letter represents increment of 5)
I like to visualize this data as lines rated more than 3 0 0 0 (results from O&M rating) in red color and anything below 3 0 0 0 in blue color
352N>3000
351g>3000
I am not sure if this make sense.
- Mark as New
- Bookmark
- Subscribe
- Mute
- Subscribe to RSS Feed
- Permalink
and i have more than 1000 features with o&M ratings from 0000 to 5P4Z
- Mark as New
- Bookmark
- Subscribe
- Mute
- Subscribe to RSS Feed
- Permalink
Hi [email protected]_stalbert ,
That is actually a simple thing to do assuming that each rating always has the same structure using 4 characters.
Please try this:
// read out rating code
var rating = $feature["Name of the field with the rating code"];
// compare with "3000"
if (rating >= "3000") {
return "Your description for red color";
} else {
return "Your description for blue color"
}
It compares the text in an alphabetic way (using the first character), assuming that "2Z2Z" is less than "3000".
- Mark as New
- Bookmark
- Subscribe
- Mute
- Subscribe to RSS Feed
- Permalink
WOW, I was thinking it would be complex. Thank you Xander Bakker