- Home
- :
- All Communities
- :
- Products
- :
- ArcGIS Online
- :
- ArcGIS Online Ideas
- :
- Infographic Widget - Multiple sort options
- Subscribe to RSS Feed
- Mark as New
- Mark as Read
- Bookmark
- Follow this Idea
- Printer Friendly Page
- Mark as New
- Bookmark
- Subscribe
- Mute
- Subscribe to RSS Feed
- Permalink
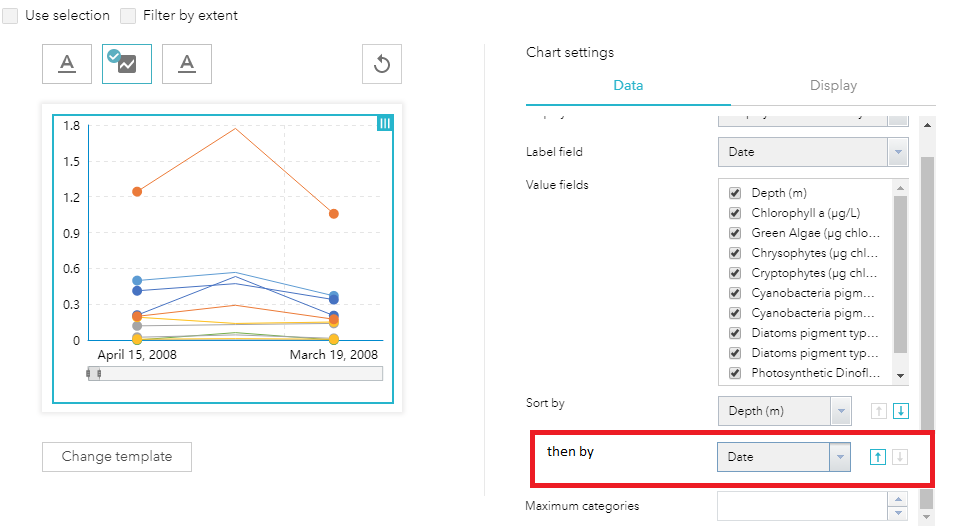
With the AGOL September 2017 update, the infographic widget allows to sort the values by an attribute which is really nice.
Yet for our client, it is not sufficient. The use case is the following:
We have measurements at a given date in a given depths (multiple depths per day). They are stored in a related table and then, the results of the query widget are displayed in a graph (using the e.g. the dashboard theme).
The x-Axis shows the date of the measurement (Feature by feature), sorted by depth, but the dates are displayed randomly.
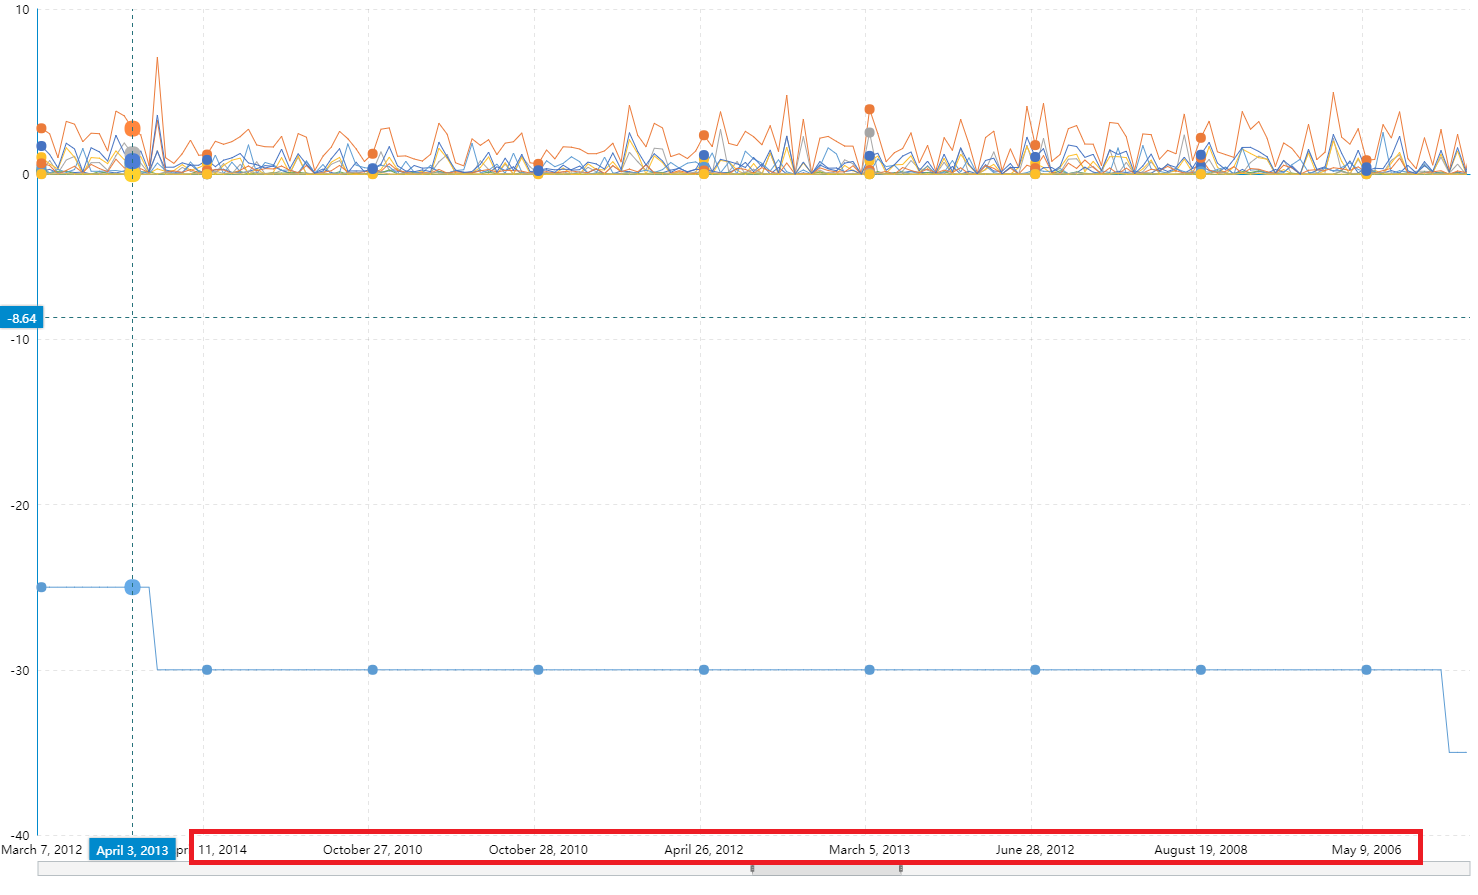
I would like to have them sorted by date as second sorting criteria, because it is hard to follow the change over time, if there is no sorting. It could be something like:
Thanks for consideration.
Annina
Just got the information from Esri Technical Support that they opened a case:
[ENH-000108816] Provide multiple sorting for Infographic Widget in Web AppBuilder ArcGIS Online
Thanks to all for your votes.
You must be a registered user to add a comment. If you've already registered, sign in. Otherwise, register and sign in.