Visualizing your data in Map Viewer takes just two quick steps.
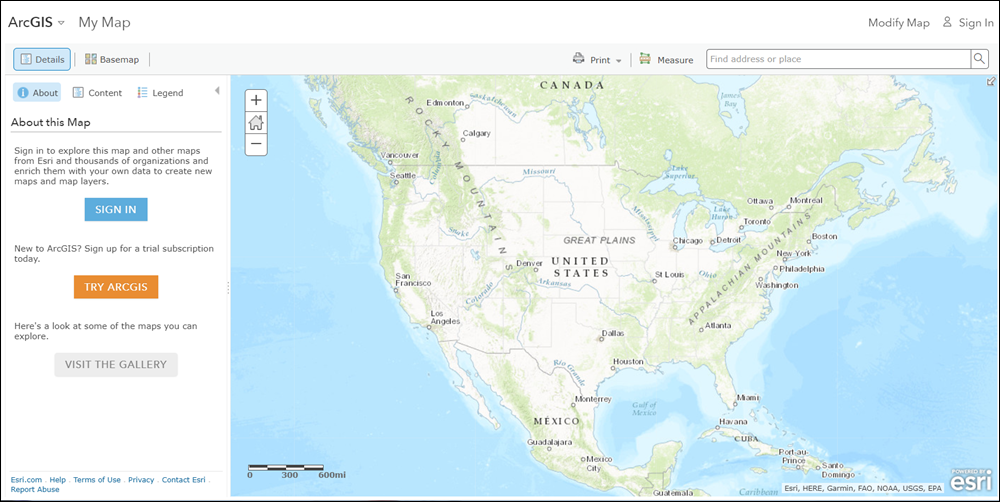
Open https://www.arcgis.com/home/webmap/viewer.html
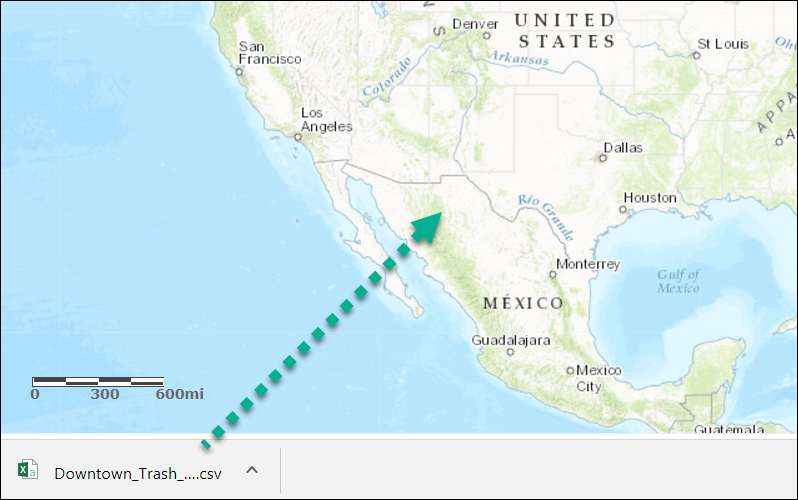
- Drag your spreadsheet file from your computer and drop it on the map.
(If you don’t have any data, you can download the Downtown Trash Receptacles spreadsheet from Data Driven Detroit.)
Map Viewer automatically applies smart mapping, highlighting what's important in your data.
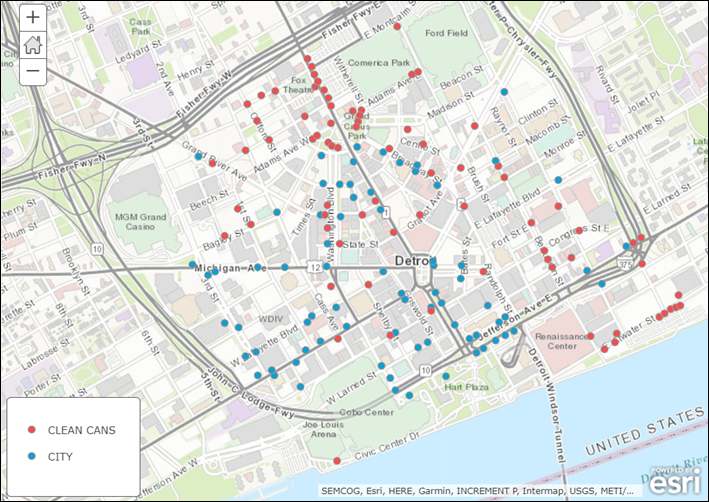
And just like that, you have an informative visual picture of your data.
Learn more