- Home
- :
- All Communities
- :
- Products
- :
- ArcGIS Monitor
- :
- ArcGIS Monitor Questions
- :
- ArcGIS Monitor reports CPU Utilization over 100%?
- Subscribe to RSS Feed
- Mark Topic as New
- Mark Topic as Read
- Float this Topic for Current User
- Bookmark
- Subscribe
- Mute
- Printer Friendly Page
ArcGIS Monitor reports CPU Utilization over 100%?
- Mark as New
- Bookmark
- Subscribe
- Mute
- Subscribe to RSS Feed
- Permalink
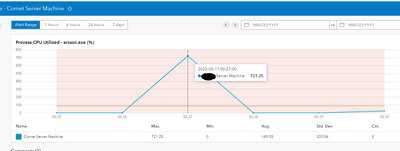
As I'm getting used to the new Monitor software, I'm noticing I'll get errors periodically for CPU Utilization exceeding 100%. Unless I'm missing something, that doesn't seem right and makes me question some of the other metrics. Looking at Monitor 10.8.1, I don't see any corresponding CPU usage spikes for the affected machine, whether I look at ArcSOCs or the system as a whole.
I mostly see this related to PostGres and ArcSOC processes. Is there something I can tweak in the settings, or is this a bug?
I'm using the 2023.1 release.
Solved! Go to Solution.
Accepted Solutions
- Mark as New
- Bookmark
- Subscribe
- Mute
- Subscribe to RSS Feed
- Permalink
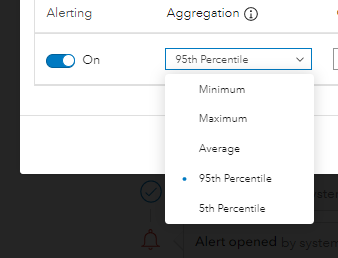
It appears like this is a single value. We'll consider limiting it to 100% to stop alerting with the current default settings. In the meantime, If you change the aggregation to 95% and/or increase sample to 5, it should stop alerting, @EsriEvan
- Mark as New
- Bookmark
- Subscribe
- Mute
- Subscribe to RSS Feed
- Permalink
Agree, cpu process > 100% does not make sense. And we've seen this occasionally. However, ArcGIS Monitor process reports windows api results. So there might a problem with windows reporting. FYI, 10.8 we capped the reporting to 100%, therefore you would not run into this case. In any case, this stat points out high activity by one or several arcsoc processes. Can you share CPU utilization on this host for the corresponding time. Also, do you see a particular arcsoc process that is using high cpu? @EsriEvan @GeoJosh
- Mark as New
- Bookmark
- Subscribe
- Mute
- Subscribe to RSS Feed
- Permalink
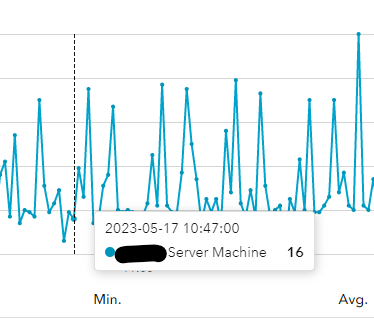
That's interesting. Here is the overall CPU utilization for that host at the same time as a high reading from this morning. At that same time, the ArcSOCs for our #1 and 2 heaviest use services are at 150% and 25% cpu, respectively.
- Mark as New
- Bookmark
- Subscribe
- Mute
- Subscribe to RSS Feed
- Permalink
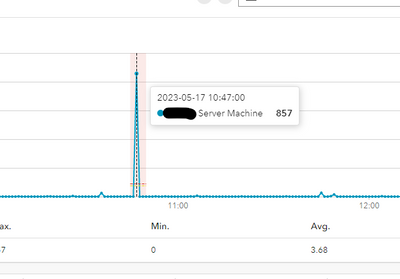
The host CPU looks OK. The process CPU spike (single value) appears to be some sort of edge condition with WinRM reporting for this particular process counter case. Is this spike just for arcsoc.exe process? How often does it happen, 12 hours? In any case, thank you for reporting it. We'll keep an eye on this and if able to reproduce, try to address it.
- Mark as New
- Bookmark
- Subscribe
- Mute
- Subscribe to RSS Feed
- Permalink
I see that for both arcsoc.exe and postgres.exe, probably 3-4 times a day for each. Not a huge deal right now, but I would love to be able to have alerting and notifications on those processes without getting my inbox flooded with spurious results!
- Mark as New
- Bookmark
- Subscribe
- Mute
- Subscribe to RSS Feed
- Permalink
It appears like this is a single value. We'll consider limiting it to 100% to stop alerting with the current default settings. In the meantime, If you change the aggregation to 95% and/or increase sample to 5, it should stop alerting, @EsriEvan
- Mark as New
- Bookmark
- Subscribe
- Mute
- Subscribe to RSS Feed
- Permalink
Thank you, I've done that. I hadn't noticed the Percentile option. That's a nice touch! I really like the level of customizability that you all have worked into the new version. I just need to learn how best to use all the new features.
- Mark as New
- Bookmark
- Subscribe
- Mute
- Subscribe to RSS Feed
- Permalink
Thank you!


