- Home
- :
- All Communities
- :
- Products
- :
- Mapping and Charting Solutions
- :
- Mapping and Charting Questions
- :
- Tiles with Easting/Northing as label
- Subscribe to RSS Feed
- Mark Topic as New
- Mark Topic as Read
- Float this Topic for Current User
- Bookmark
- Subscribe
- Mute
- Printer Friendly Page
- Mark as New
- Bookmark
- Subscribe
- Mute
- Subscribe to RSS Feed
- Permalink
- Report Inappropriate Content
Hi Experts,
Do you know of a way to generate array of tiles in spec size - but labeled according to their Easting Northing?
Thank you
J
Solved! Go to Solution.
Accepted Solutions
- Mark as New
- Bookmark
- Subscribe
- Mute
- Subscribe to RSS Feed
- Permalink
- Report Inappropriate Content
Hi J(?),
If you use graticules the corners of the "cells" can be found at the border of the map. If you want to labels to show on the cell itself, I guess you would have to create the fishnet (physical layer) and label it. If you can visualize it a little more, I might be able to give you some pointers.
Kind regards, Xander
- Mark as New
- Bookmark
- Subscribe
- Mute
- Subscribe to RSS Feed
- Permalink
- Report Inappropriate Content
If you physically want to create a featureclass with tiles of specific size you can use the option:
Create Fishnet (Data Management)
If the purpose is to show this on the map layout, you can make use of a grid or a graticule
- Mark as New
- Bookmark
- Subscribe
- Mute
- Subscribe to RSS Feed
- Permalink
- Report Inappropriate Content
Hi Xander,
Really sorry for late response - and thanks for your time AND KNOWLEDGE
May I ask one more.... is it possible to label these cells with coordinates of their corner?
Thanks in advance,
J
- Mark as New
- Bookmark
- Subscribe
- Mute
- Subscribe to RSS Feed
- Permalink
- Report Inappropriate Content
Just noticed...
This NET is created based on the number of lines... do you know whether it can be converted into cells? I am bascially looking for a way to cover a specific area with number of regular cells/bin...
Thanks
J
- Mark as New
- Bookmark
- Subscribe
- Mute
- Subscribe to RSS Feed
- Permalink
- Report Inappropriate Content
In that case the Fishnet would be the way to go.
In the Fishnet dialog, specify your lower left corner (rounded coordinates, which should be multiples of the cell size) at "Fishnet Origin Coordinate".
At "Y-axis coordinate" specify your upper left corner (I assume you don't have rotation)
At Cell Size With and Height specify the size of your cell
At Number of Rows specify the number of cells you want vertically and at number of Columns specify the number of cells you want horizontally.
Select polygons as output geometry.
This creates featureclass of the cell polygons. Now labeling is a different aspect. The fishnet created (and optional labels) don't have any additional information on the cell coordinates. However you can add this information through the FieldCalculator:
- Add a new text field
- Calculate the Field (right click on column header)
- Specify the following information:
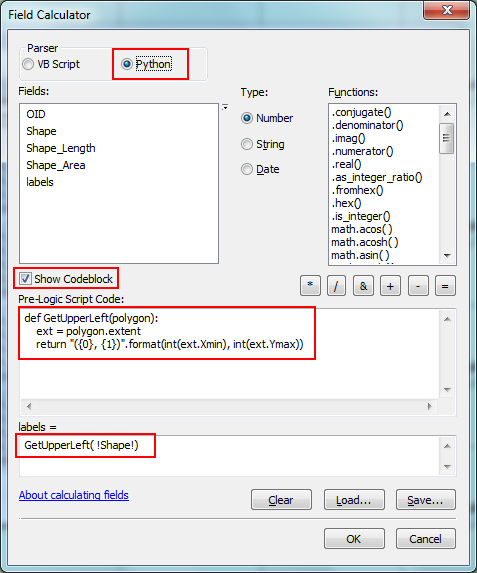
This will fill the newly added field with the text "(X value, Y value)". Labels the featureclass with this field.
You can add an label expression to add additional text:
"Upper left (E, N):" & vbnewline & [labels]
This will create a label like:
Upper left (E, N):
(X value, Y value)
The only point is, that the label will be centered in the cell.
Kind regards, Xander
- Mark as New
- Bookmark
- Subscribe
- Mute
- Subscribe to RSS Feed
- Permalink
- Report Inappropriate Content
With respect to the placement of the labels, an option would be to use the optional points created in the Fishnet tool to label the cells. Since the points describe the center of the cell, the would have to be moved. This can be done with the FieldCalculator:
- At the fishnet tool switch on the option "Create label points"
- In the resulting point featureclass add a text field (for instance "labels")
- Let's first move the points using the FieldCalculator. Calculate the Shape field as follows:
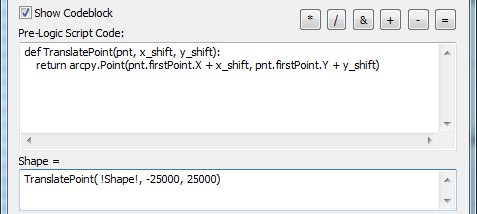
The pre-logic script is:
def TranslatePoint(pnt, x_shift, y_shift):
    return arcpy.Point(pnt.firstPoint.X + x_shift, pnt.firstPoint.Y + y_shift)
At the "Shape =" part enter the formula:
TranslatePoint( !Shape! , -1 * half your cell size, +1 * half your cell size)
This will move the point half the cell size to the left and half the cell size up to go to the upper left corner.
The next step will be to fill the labels field with the text for the labels; calculate the "labels" field:
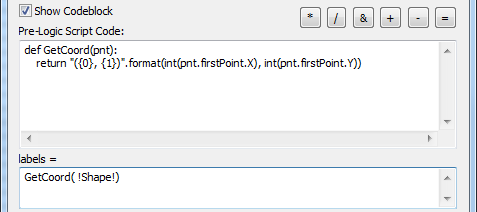
The pre-logic script is:
def GetCoord(pnt):
    return "({0}, {1})".format(int(pnt.firstPoint.X), int(pnt.firstPoint.Y))
At the "labels =" part enter the formula:
GetCoord( !Shape! )
This will create a text of "(Easting, Northing)". Use this field to label the points to get something like this:
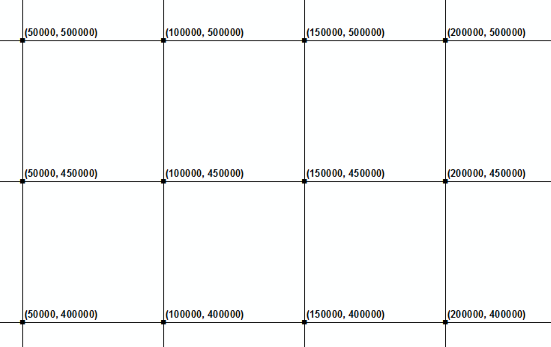
Kind regards, Xander
- Mark as New
- Bookmark
- Subscribe
- Mute
- Subscribe to RSS Feed
- Permalink
- Report Inappropriate Content
Hi J(?),
If you use graticules the corners of the "cells" can be found at the border of the map. If you want to labels to show on the cell itself, I guess you would have to create the fishnet (physical layer) and label it. If you can visualize it a little more, I might be able to give you some pointers.
Kind regards, Xander
- Mark as New
- Bookmark
- Subscribe
- Mute
- Subscribe to RSS Feed
- Permalink
- Report Inappropriate Content
Wow,
Xander
Sorry for a little delay in response and massive, MASSIVE thank you for your expertise!
J
- Mark as New
- Bookmark
- Subscribe
- Mute
- Subscribe to RSS Feed
- Permalink
- Report Inappropriate Content
You're welcome!