- Home
- :
- All Communities
- :
- Products
- :
- Mapping and Charting Solutions
- :
- Mapping and Charting Questions
- :
- Re: Facing problem with symbolization
- Subscribe to RSS Feed
- Mark Topic as New
- Mark Topic as Read
- Float this Topic for Current User
- Bookmark
- Subscribe
- Mute
- Printer Friendly Page
- Mark as New
- Bookmark
- Subscribe
- Mute
- Subscribe to RSS Feed
- Permalink
Hi All,
I am a fresh-man in GIS. I have just faced a problem and I am sharing it to have the best answer for its solution:
I have a map to generate and show the types of training and number of participants on the map province/state wise. I want to show each training type with a symbol i.e. square, circle, rectangle; in addition also show the total number of participants per training and per province/state. (Below, I have attached the table for better understanding)
i.e. there have been 4 types of training in Kabul province. with ASP having 486 participants, Java having 36 Participants, VB having 753 participants and C++ having 101 participants.
I would be highly appreciated, to have your views and guidance.
| Province | ASP | Java | VB | C++ |
| Badakhshan | 233 | 362 | 35 | |
| Badghis | 53 | |||
| Baghlan | 54 | |||
| Balkh | 125 | 184 | 9 | |
| Bamyan | 78 | 233 | 29 | |
| Daykundi | 55 | 154 | ||
| Farah | 30 | |||
| Faryab | 30 | |||
| Ghazni | 32 | |||
| Ghor | 53 | 119 | ||
| Helmand | 45 | 131 | 12 | |
| Herat | 204 | 364 | 28 | |
| Jowzjan | 62 | 203 | ||
| Kabul | 486 | 36 | 753 | 101 |
| Kandahar | 40 | 160 | ||
| Kapisa | 210 | |||
| Khost | 81 | |||
| Kunar | 63 | 14 | 123 | |
| Kunduz | 89 | 422 | 44 | |
| Laghman | 32 | 165 | 14 | |
| Logar | 22 | 45 | ||
| Nangarhar | 159 | 187 | 36 | |
| Nimroz | 28 | |||
| Paktia | 38 | |||
| Paktika | 29 | 77 | ||
| Panjshir | 114 | |||
| Parwan | 108 | |||
| Samangan | 37 | 78 | ||
| Takhar | 101 | 14 | 57 | |
| Uruzgan | 134 | |||
| Wardak | 145 |
Solved! Go to Solution.
Accepted Solutions
- Mark as New
- Bookmark
- Subscribe
- Mute
- Subscribe to RSS Feed
- Permalink
Try this link to get information on generation of a point at the centroid of each polygon.
You can then symbolize the point.
- Mark as New
- Bookmark
- Subscribe
- Mute
- Subscribe to RSS Feed
- Permalink
I am assuming this is spatial data like a shapefile or table with x/y values present? If so, after importing your data into ArcGIS, navigate to the 'Symbology' tab of the layer in question.
The 'Categories' option should allow you the flexibility to symbolize your data to specification. Test out some of the options there.
Best of luck!

- Mark as New
- Bookmark
- Subscribe
- Mute
- Subscribe to RSS Feed
- Permalink
Thanks james for your comment. Actually, I tested all the categories options under symbolize tab of the layer properties. but it only provide with fill option. while I need to just show the training type with a circle, square or rectangular shape and also show the number of participants of the relevant training type.
The point to be noted, is that the a single province/state has hosted more than one training at a time.
FYI, I am using access geo-database. Looking forward to hear back!
Thanks in advance.
- Mark as New
- Bookmark
- Subscribe
- Mute
- Subscribe to RSS Feed
- Permalink
Try this link to get information on generation of a point at the centroid of each polygon.
You can then symbolize the point.
- Mark as New
- Bookmark
- Subscribe
- Mute
- Subscribe to RSS Feed
- Permalink
Again facing a problem, as I need to show the number of participants for each training type on in its own province/state! Can anyone help out! Thanks in advance
- Mark as New
- Bookmark
- Subscribe
- Mute
- Subscribe to RSS Feed
- Permalink
Hi Shekib, one possibility is to symbolize using charts. Here's the help file on that: ArcGIS Help 10.1. I'm assuming that you already have your data attached to a shapefile of the provinces. If not, let me know and I can walk you through that.
- Mark as New
- Bookmark
- Subscribe
- Mute
- Subscribe to RSS Feed
- Permalink
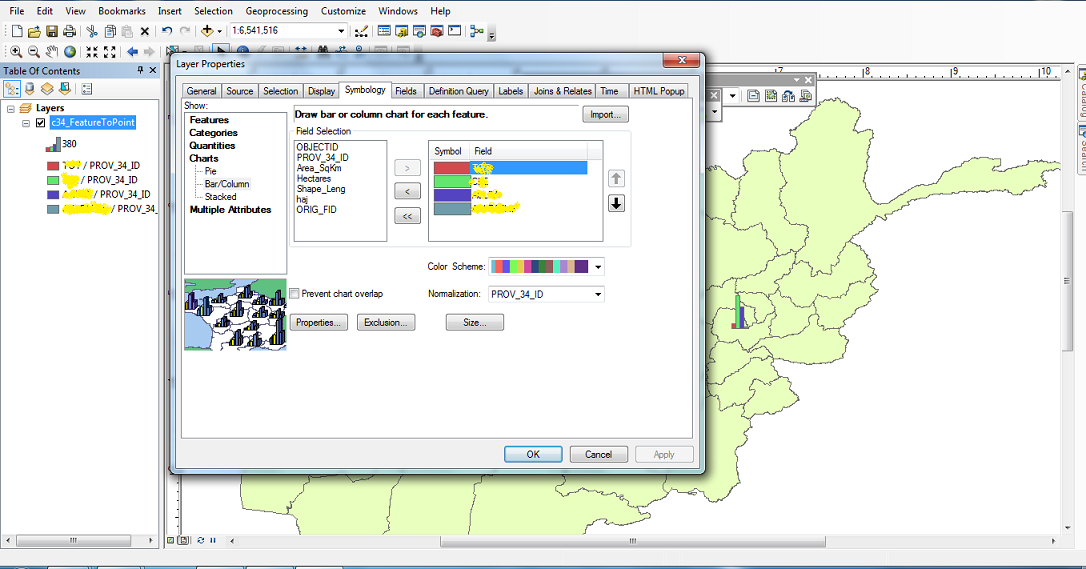
Hey Sephe, Thanks for the help; but I am the chart shows only in one polygon not in the whole map, though there is no restriction. Can you help out with!
FYI, The data is already attached to the shapefile.
Thanks a heap.
Shekib
- Mark as New
- Bookmark
- Subscribe
- Mute
- Subscribe to RSS Feed
- Permalink
please see below the print screen
- Mark as New
- Bookmark
- Subscribe
- Mute
- Subscribe to RSS Feed
- Permalink
Are these point features? I see it says feature to point in the table of contents. Your data needs to be arranged, so that each province in the polygon features has values in four fields for your programming languages, just like in the table you have at the top. Is that how your data is now?