- Home
- :
- All Communities
- :
- Developers
- :
- JavaScript Maps SDK
- :
- JavaScript Maps SDK Questions
- :
- how to add graphics to selected object in data gri...
- Subscribe to RSS Feed
- Mark Topic as New
- Mark Topic as Read
- Float this Topic for Current User
- Bookmark
- Subscribe
- Mute
- Printer Friendly Page
how to add graphics to selected object in data grid.
- Mark as New
- Bookmark
- Subscribe
- Mute
- Subscribe to RSS Feed
- Permalink
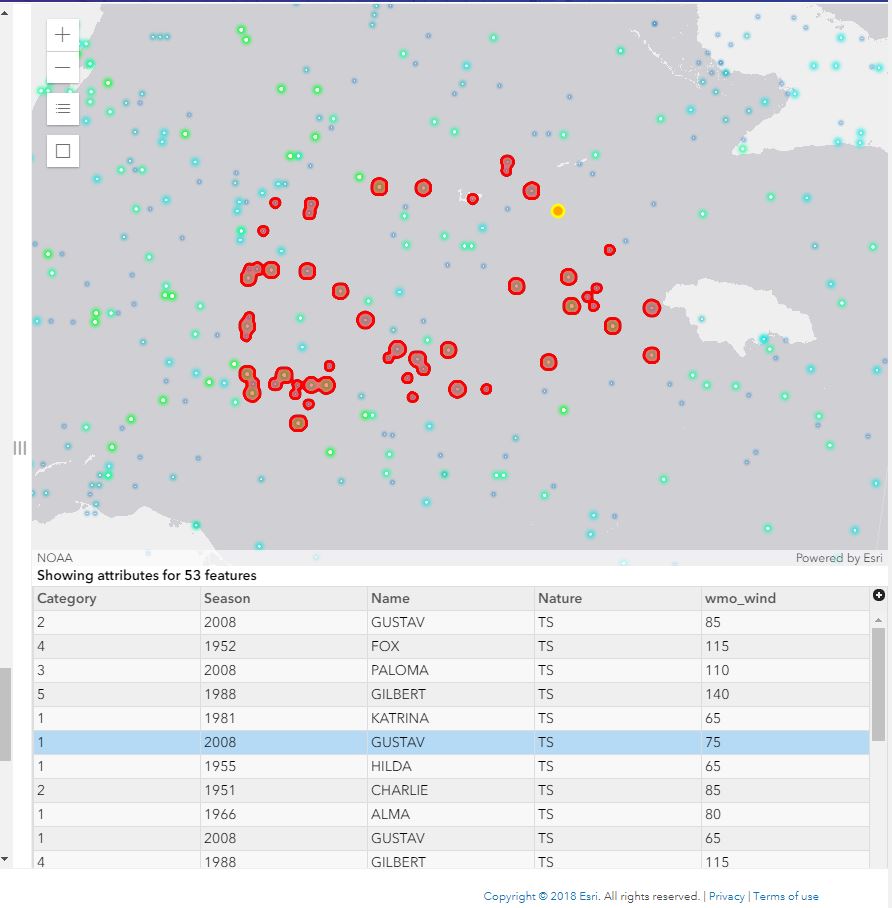
How to add a graphics to selected object...So after performing query task, when we click on any record in grid it highlights that specific record on map with specific color..
i tried this with using
popup: {
highlightEnabled: true,
dockEnabled: true,
dockOptions: {
position: "top-right",
breakpoint: true
}
}
refering sample
https://developers.arcgis.com/javascript/latest/sample-code/sandbox/index.html?sample=highlight-feat...
am expecting the graphics like below image..
Solved! Go to Solution.
- Mark as New
- Bookmark
- Subscribe
- Mute
- Subscribe to RSS Feed
- Permalink
I can understand Sir, but you are the most known person to me who having enough knowledge in ArcGIS Javascript.
No any other person knows this much. I think these are less complicated issues for you as compare me or any other person...Can you please help me with only 2-3 issues.
3D SCENE | Trying to Improve 3D scene which displays all vertical pipes in 3D view. I am usingField: INVERT-ELEVATION and Primitive: Cylinder. Trying to display all vertical pipes layers in 3D view. Able to display but it’s not displaying according to INVERT-ELEVATION field right now. So I set manual height and depth to these vertical pipes. |
SWITCH FOR 3D & 2D | Is it possible to add a function to switch 2D to 3D view and vice-versa Cause in this application I am only trying to display vertical pipes in 3D view horizontal pipes are only in 2D view. |
- Mark as New
- Bookmark
- Subscribe
- Mute
- Subscribe to RSS Feed
- Permalink
ok I'll create new question task. please take a look.. I'll tag you in it.
Thanks
- « Previous
-
- 1
- 2
- Next »
- « Previous
-
- 1
- 2
- Next »