Turn on suggestions
Auto-suggest helps you quickly narrow down your search results by suggesting possible matches as you type.
Cancel
- Home
- :
- All Communities
- :
- Developers
- :
- JavaScript Maps SDK
- :
- JavaScript Maps SDK Questions
- :
- How do I make some simple rectangles with some tex...
Options
- Subscribe to RSS Feed
- Mark Topic as New
- Mark Topic as Read
- Float this Topic for Current User
- Bookmark
- Subscribe
- Mute
- Printer Friendly Page
How do I make some simple rectangles with some text next to it?
Subscribe
5294
4
02-24-2014 03:40 AM
02-24-2014
03:40 AM
- Mark as New
- Bookmark
- Subscribe
- Mute
- Subscribe to RSS Feed
- Permalink
Hi all experts,
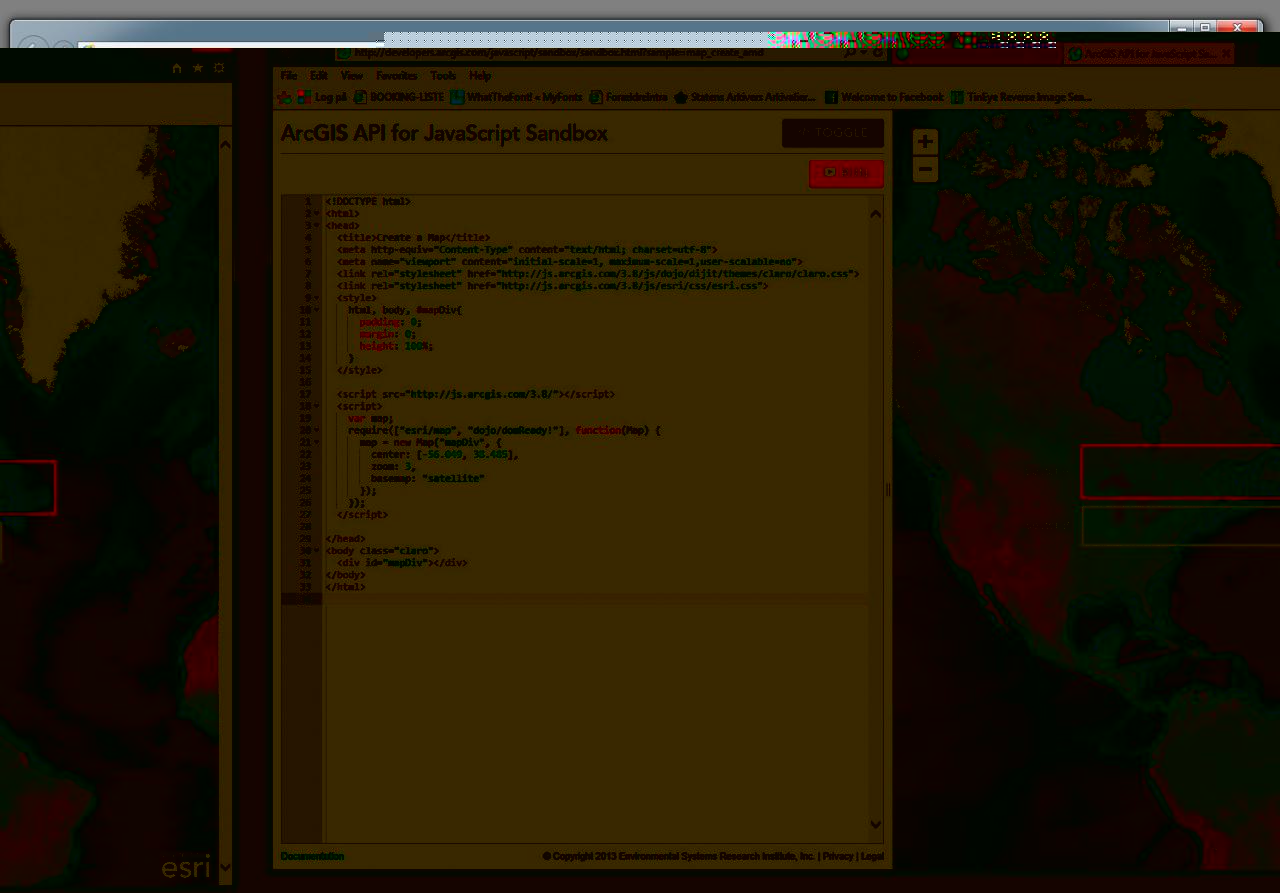
I know that this is probably very simple, but I can not figure out how I get drawn 2 rectangles on the map with some text next to it (see attached picture).
[ATTACH=CONFIG]31696[/ATTACH]
I've tried in the sandbox but nothing works, can anyone help?
The complete html code would be nice! 🙂
Thanks in advance
Sincerely,
Andy Green
4 Replies
02-24-2014
05:39 AM
- Mark as New
- Bookmark
- Subscribe
- Mute
- Subscribe to RSS Feed
- Permalink
Hi Andy,
You can use the Draw and TextSymbol classes to achieve this. Use a geometry service to find a point for placing a label inside or around the drawn polygon. You can see an example here.
You can use the Draw and TextSymbol classes to achieve this. Use a geometry service to find a point for placing a label inside or around the drawn polygon. You can see an example here.
02-24-2014
01:43 PM
- Mark as New
- Bookmark
- Subscribe
- Mute
- Subscribe to RSS Feed
- Permalink
Hi Andy,
You can use the Draw and TextSymbol classes to achieve this. Use a geometry service to find a point for placing a label inside or around the drawn polygon. You can see an example here.
Thanks a lot, Jake 🙂
But I don't get it? - and I don't know how to use "Edit Fiddle", sorry.
I don't want to "draw" with toolsbars or anything fancy, I just need some (probably just 10 lines of code) to put a static rectangle onto my map as I illustrated on the image I attached.
For example on Google Maps API, I would use this piece of code, and this works just fine!
There must be something similar I can use in the sandbox?
var rectangle = new google.maps.Rectangle({
strokeColor: '#FFFF00',
strokeOpacity: 1.0,
strokeWeight: 1,
fillColor: '#FF0000',
fillOpacity: 0.0,
map: map,
bounds: new google.maps.LatLngBounds(
new google.maps.LatLng(40.32, 124.50),
new google.maps.LatLng(40.26, 128.70))
});
Best 🙂 Andy
02-25-2014
02:12 AM
- Mark as New
- Bookmark
- Subscribe
- Mute
- Subscribe to RSS Feed
- Permalink
You will want to use the Graphic class to create the graphic and add it to your map. Ex:
<!DOCTYPE html>
<html>
<head>
  <title>Create a Map</title>
  <meta http-equiv="Content-Type" content="text/html; charset=utf-8">
  <meta name="viewport" content="initial-scale=1, maximum-scale=1,user-scalable=no">
  <link rel="stylesheet" href="http://js.arcgis.com/3.8/js/dojo/dijit/themes/claro/claro.css">
  <link rel="stylesheet" href="http://js.arcgis.com/3.8/js/esri/css/esri.css">
  <style>
    html, body, #mapDiv{
      padding: 0;
      margin: 0;
      height: 100%;
    }
  </style>

  <script src="http://js.arcgis.com/3.8/"></script>
  <script>
    var map;
    require([
        "esri/map",
        "esri/symbols/SimpleFillSymbol",
        "esri/symbols/SimpleLineSymbol",
        "dojo/_base/Color",
        "esri/graphic",

        "esri/geometry/Polygon",

        "dojo/on",
        "dojo/dom",
        "dojo/domReady!"
    ],
    function(
        Map, SimpleFillSymbol, SimpleLineSymbol, Color, Graphic,
        Polygon,
        on, dom
    ) {
      map = new Map("mapDiv", {
        center: [-75.249, 38.485],
        zoom: 9,
        basemap: "streets"
      });

      on(map, "load", addGraphic);

      var sfs = new SimpleFillSymbol(SimpleFillSymbol.STYLE_SOLID,
        new SimpleLineSymbol(SimpleLineSymbol.STYLE_SOLID,
        new Color([255,0,0]), 2),new Color([255,255,0,0.25])
        )

      function addGraphic(){
            var singleRingPolygon = new Polygon([[-75.77, 38.45], [-75.77, 38.7], [-75.11, 38.7], [-75.11, 38.45], [-75.77, 38.45]])
            var gra = new Graphic(singleRingPolygon, sfs);
            map.graphics.add(gra);
      }


    });
  </script>

</head>
<body class="claro">
  <div id="mapDiv"></div>
</body>
</html>
02-25-2014
06:01 AM
- Mark as New
- Bookmark
- Subscribe
- Mute
- Subscribe to RSS Feed
- Permalink
You will want to use the Graphic class to create the graphic and add it to your map. Ex:<!DOCTYPE html> <html> <head> <title>Create a Map</title> <meta http-equiv="Content-Type" content="text/html; charset=utf-8"> <meta name="viewport" content="initial-scale=1, maximum-scale=1,user-scalable=no"> <link rel="stylesheet" href="http://js.arcgis.com/3.8/js/dojo/dijit/themes/claro/claro.css"> <link rel="stylesheet" href="http://js.arcgis.com/3.8/js/esri/css/esri.css"> <style> html, body, #mapDiv{ padding: 0; margin: 0; height: 100%; } </style> <script src="http://js.arcgis.com/3.8/"></script> <script> var map; require([ "esri/map", "esri/symbols/SimpleFillSymbol", "esri/symbols/SimpleLineSymbol", "dojo/_base/Color", "esri/graphic", "esri/geometry/Polygon", "dojo/on", "dojo/dom", "dojo/domReady!" ], function( Map, SimpleFillSymbol, SimpleLineSymbol, Color, Graphic, Polygon, on, dom ) { map = new Map("mapDiv", { center: [-75.249, 38.485], zoom: 9, basemap: "streets" }); on(map, "load", addGraphic); var sfs = new SimpleFillSymbol(SimpleFillSymbol.STYLE_SOLID, new SimpleLineSymbol(SimpleLineSymbol.STYLE_SOLID, new Color([255,0,0]), 2),new Color([255,255,0,0.25]) ) function addGraphic(){ var singleRingPolygon = new Polygon([[-75.77, 38.45], [-75.77, 38.7], [-75.11, 38.7], [-75.11, 38.45], [-75.77, 38.45]]) var gra = new Graphic(singleRingPolygon, sfs); map.graphics.add(gra); } }); </script> </head> <body class="claro"> <div id="mapDiv"></div> </body> </html>
JUST PERFECT !!! - Thank you 1000 times 🙂