Hi,
I am trying to show the column chart on click of a map on info template window, which is working fine for positive values. But whereas for negative values, the x-axis doesn't move to '0' of Y-axis. Please find below image

X-Axis remains at bottom every time, even when all the 3 column values are negative. Please find below image
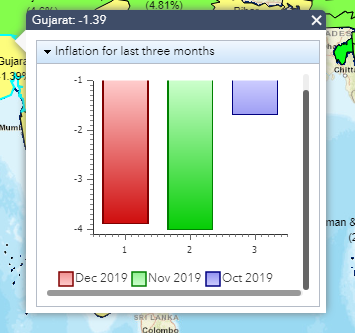
Here the X-axis line shall be on top.
Can anyone help me!!
Regards,