- Home
- :
- All Communities
- :
- Products
- :
- ArcGIS Image Server
- :
- ArcGIS Image Server Questions
- :
- Display values of mosaic data set
- Subscribe to RSS Feed
- Mark Topic as New
- Mark Topic as Read
- Float this Topic for Current User
- Bookmark
- Subscribe
- Mute
- Printer Friendly Page
Display values of mosaic data set
- Mark as New
- Bookmark
- Subscribe
- Mute
- Subscribe to RSS Feed
- Permalink
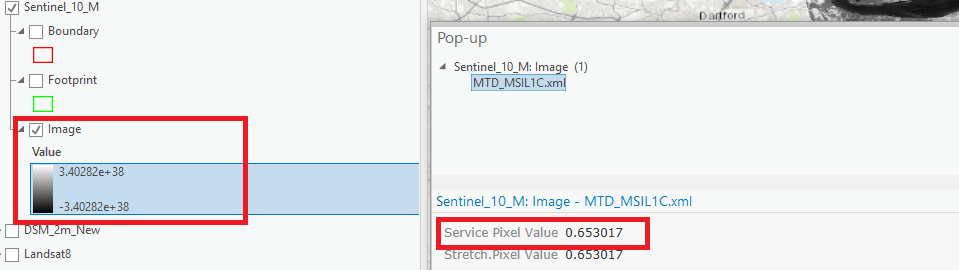
I have applied raster function to calculate NDVI for Sentinel 2. The values of NDVI supposed to be in between -1 and 1. When I click to Identify the pixel value, I believe I get correct values, lets say 0.65, but in contents pane the values are displayed differently. See image.
Question:
How shall I set up symbology so it displays correct values in Contents Pane? In addition, because I use Raster Templates, it would be useful if I could incorporate this symbology into the Raster function.
Regards,
Ben
- Mark as New
- Bookmark
- Subscribe
- Mute
- Subscribe to RSS Feed
- Permalink
check your 'symbology', perhaps your color ramp is stretched. You can change the symbology type and the ranges there
- Mark as New
- Bookmark
- Subscribe
- Mute
- Subscribe to RSS Feed
- Permalink
Benas,
did you create your own "RFT" to achieve this, or use an Esri-supplied one? We have quite a number of optimized ones, resulting in Legends like this:
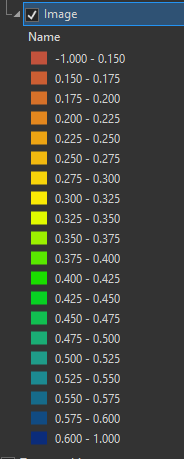
if you want to create something like this yourself, see this post: Classified Raster - Legend issue ... the recalss and attribute table process is what you are looking for.
If you want to use some of the ones we have developed, download this zip: https://www.arcgis.com/home/item.html?id=e6e1f20cb0374d28a6eed24f5c2ff51b and then open it, go to the folder ../Parameter/RasterFunction Templates and then analyze/use the one you need.
PLUS and you might also find this:
https://www.arcgis.com/home/group.html?id=69c72a55bb77411c83955d14bee680d8#overview
interesting!
Regards
Guenter