- Home
- :
- All Communities
- :
- Products
- :
- ArcGIS Hub
- :
- ArcGIS Hub Questions
- :
- Map Visualization in ArcGIS Hub
- Subscribe to RSS Feed
- Mark Topic as New
- Mark Topic as Read
- Float this Topic for Current User
- Bookmark
- Subscribe
- Mute
- Printer Friendly Page
Map Visualization in ArcGIS Hub
- Mark as New
- Bookmark
- Subscribe
- Mute
- Subscribe to RSS Feed
- Permalink
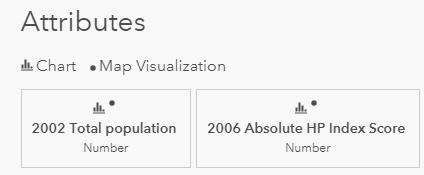
Hi I would like to click in one of the fields of my dataset and get the thematic map related to that field. In my dataset though I don't see the Map Visualization icon as it shows below.
So I checked this info in ESRI website:
>> In order to do this, you need to create a smart map visualization. The steps are as follows:
- Ensure that the dataset you want to visualize is zoomed in far enough to display all the features on the map.
- In the attributes list, click on an attribute that has a map visualization icon.
- A legend will appear at the top right of the map.
- Whole number values will be visualized with choropleth symbolization.
- Decimal number values will be visualized with graduated symbolization.
- Text values will be visualized with choropleth symbolization.
- Values from datasets on older versions of ArcGIS Server may not be smart mapped.
Please note that map visualizations are limited to fields that have 20 or fewer unique values.
I tried to follow these steps, even by modifying some of my data so I could have at least in my interested field less than 20 unique values and I didn't get any result.
But please check this link: http://data-irelandsdg.opendata.arcgis.com/datasets/sdg-1.2.1-proportion-of-population-living-below-...
Most of the fields in this dataset have more than 20 unique values, and still able to use Map Visualization.
Any recommendation please?
Thank you!
Besa