- Home
- :
- All Communities
- :
- Products
- :
- ArcGIS Hub
- :
- ArcGIS Hub Questions
- :
- How to Interpret Enhanced Vegetation Index( EVI) V...
- Subscribe to RSS Feed
- Mark Topic as New
- Mark Topic as Read
- Float this Topic for Current User
- Bookmark
- Subscribe
- Mute
- Printer Friendly Page
How to Interpret Enhanced Vegetation Index( EVI) Values ?
- Mark as New
- Bookmark
- Subscribe
- Mute
- Subscribe to RSS Feed
- Permalink
Im working on calculation of Calculation of Enhanced Vegetation Index(EVI) From Landsat 5 TM and Landsat 8 OLI Using ArcMap 10.4.1. As far i know to Calculate EVI, first it needs to Convert the DN Values to Physical TOA reflectance. For Landsat 5 TM, I did that steps (First I converted DN to Radiance and then to Reflectance and
got the refelectance Values of the required bands ranging between 0 to 1 (Band 1 =0 to 0.367, Band 3= 0 to 0.648, Band 4= 0 to 0.808).
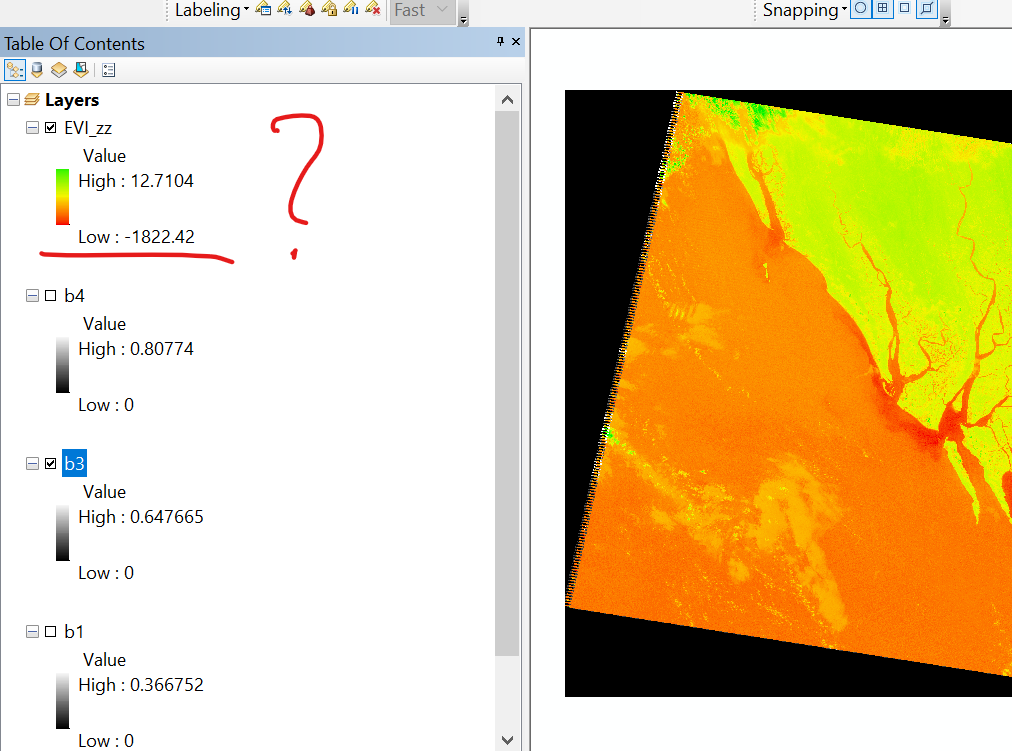
Then I applied the Formula for Deriving EVI= 2.5 * (("Band 4" - "Band 3") / "Band 4" + 6 * "Band 3" - 7.5 * "Band 1" + 1) in Raster Calculator and got result with EVI Ranging -1822.42 to 12.71 (!) . If i clip my Area of Interest Still get the Value ranges between -0.658 to +2.95.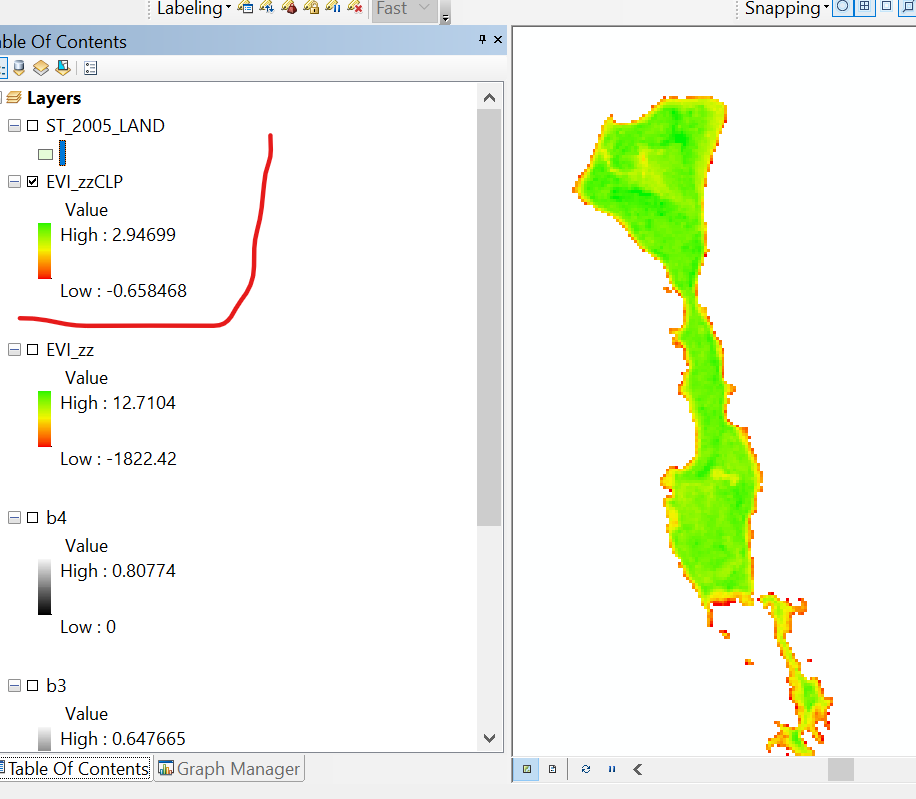
I used to know that EVI ranges between -1 to +1 , However USGS says The valid Range is between -10,000 to +10,000) see https://www.usgs.gov/land-resources/nli/landsat/landsat-enhanced-vegetation-index?qt-science_support... And i know EVI is not a Normalized Index like NDVI.
Now I really Want to know if my precedure is okay, and then how can I interpret The values? (eg. Vegetation, Bare Soil etc). And If not then how can I Correctly Calculate EVI?