Turn on suggestions
Auto-suggest helps you quickly narrow down your search results by suggesting possible matches as you type.
Cancel
- Home
- :
- All Communities
- :
- Products
- :
- ArcGIS GeoStatistical Analyst
- :
- ArcGIS GeoStatistical Analyst Questions
- :
- Understanding Kernel Interpolation Result
Options
- Subscribe to RSS Feed
- Mark Topic as New
- Mark Topic as Read
- Float this Topic for Current User
- Bookmark
- Subscribe
- Mute
- Printer Friendly Page
03-03-2014
12:15 PM
- Mark as New
- Bookmark
- Subscribe
- Mute
- Subscribe to RSS Feed
- Permalink
[ATTACH=CONFIG]31908[/ATTACH]
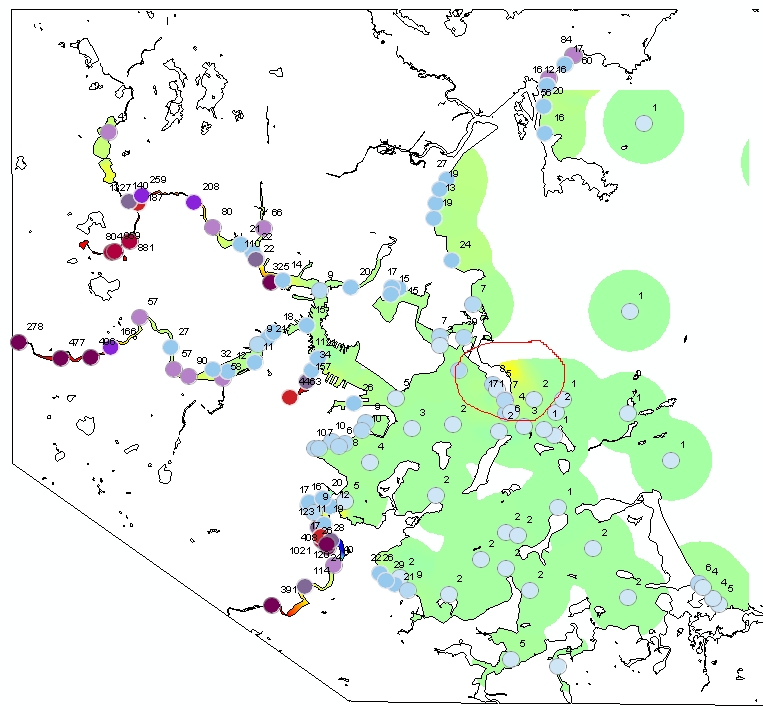
Hi, I am doing an Kernel Interpolation with Barriers with bacteria data in a bunch of sampling stations in boston harbor, indicated by colored dots in the picture. The resulting raster I got graduates from green(lowest) to red(highest). White area with black outline indicates land.
I need help on understanding how the circled out area got the somewhat high result, when there is not a single dot containing high input around.
Thanks for any input.
my
Solved! Go to Solution.
1 Solution
Accepted Solutions
03-06-2014
07:47 AM
- Mark as New
- Bookmark
- Subscribe
- Mute
- Subscribe to RSS Feed
- Permalink
Thanks for sending the data. Luckily, it didn't take long to find the problem. The issue is the point with a value of 171 (FID = 44). This point is 40 meters north-east of a point with a value of 7 (FID = 75).
This rapid change in the data values is a problem for Kernel Interpolation with Barriers because the tool works by chasing linear trends in the data values. In this area, it detected a rapid upwards trend because the data values changed rapidly from 7 to 171 in a distance of only 40 meters. Since there is no additional data north-east of the point with a value of 171 to calibrate the trend, the model assumed that this upwards trend would continue. That is why you are getting high predictions in the area to the north-east of these two points.
If the value of 171 is a typo, it should be corrected. Otherwise, you should consider removing it from the dataset because it is clearly causing stability problems.
6 Replies
03-06-2014
05:41 AM
- Mark as New
- Bookmark
- Subscribe
- Mute
- Subscribe to RSS Feed
- Permalink
It's hard to tell what is happening from that picture. Is it possible to send your data to [email protected] so that I can take a closer look?
03-06-2014
07:23 AM
- Mark as New
- Bookmark
- Subscribe
- Mute
- Subscribe to RSS Feed
- Permalink
It's hard to tell what is happening from that picture. Is it possible to send your data to [email protected] so that I can take a closer look?
Of course.
I've sent you an email with attachments.
Thanks so much for your time.
my
03-06-2014
07:47 AM
- Mark as New
- Bookmark
- Subscribe
- Mute
- Subscribe to RSS Feed
- Permalink
Thanks for sending the data. Luckily, it didn't take long to find the problem. The issue is the point with a value of 171 (FID = 44). This point is 40 meters north-east of a point with a value of 7 (FID = 75).
This rapid change in the data values is a problem for Kernel Interpolation with Barriers because the tool works by chasing linear trends in the data values. In this area, it detected a rapid upwards trend because the data values changed rapidly from 7 to 171 in a distance of only 40 meters. Since there is no additional data north-east of the point with a value of 171 to calibrate the trend, the model assumed that this upwards trend would continue. That is why you are getting high predictions in the area to the north-east of these two points.
If the value of 171 is a typo, it should be corrected. Otherwise, you should consider removing it from the dataset because it is clearly causing stability problems.
This rapid change in the data values is a problem for Kernel Interpolation with Barriers because the tool works by chasing linear trends in the data values. In this area, it detected a rapid upwards trend because the data values changed rapidly from 7 to 171 in a distance of only 40 meters. Since there is no additional data north-east of the point with a value of 171 to calibrate the trend, the model assumed that this upwards trend would continue. That is why you are getting high predictions in the area to the north-east of these two points.
If the value of 171 is a typo, it should be corrected. Otherwise, you should consider removing it from the dataset because it is clearly causing stability problems.
03-06-2014
08:07 AM
- Mark as New
- Bookmark
- Subscribe
- Mute
- Subscribe to RSS Feed
- Permalink
Thanks for sending the data. Luckily, it didn't take long to find the problem. The issue is the point with a value of 171 (FID = 44). This point is 40 meters north-east of a point with a value of 7 (FID = 75).
This rapid change in the data values is a problem for Kernel Interpolation with Barriers because the tool works by chasing linear trends in the data values. In this area, it detected a rapid upwards trend because the data values changed rapidly from 7 to 171 in a distance of only 40 meters. Since there is no additional data north-east of the point with a value of 171 to calibrate the trend, the model assumed that this upwards trend would continue. That is why you are getting high predictions in the area to the north-east of these two points.
If the value of 171 is a typo, it should be corrected. Otherwise, you should consider removing it from the dataset because it is clearly causing stability problems.
Eric,
Thanks for getting back at lightning speed.
After reading your explanation I looked for the 171 value and embarrassingly enough, it is a point that I did not see previously.
But solid explanation, very helpful.
my
03-06-2014
09:06 AM
- Mark as New
- Bookmark
- Subscribe
- Mute
- Subscribe to RSS Feed
- Permalink
Eric,
Thanks for getting back at lightning speed.
After reading your explanation I looked for the 171 value and embarrassingly enough, it is a point that I did not see previously.
But solid explanation, very helpful.
my
Next time, you might consider setting the drawing order of the points with their colors, to reflect the range from low to high by using Symbol Levels. This way, the high value would have been obvious, as drawn last and on top of the others, instead of being hidden:
What is symbol level drawing?
Marco
03-06-2014
10:02 AM
- Mark as New
- Bookmark
- Subscribe
- Mute
- Subscribe to RSS Feed
- Permalink
Next time, you might consider setting the drawing order of the points with their colors, to reflect the range from low to high by using Symbol Levels. This way, the high value would have been obvious, as drawn last and on top of the others, instead of being hidden:
What is symbol level drawing?
Marco
Yep, great tip.
Thanks!
my