- Home
- :
- All Communities
- :
- Products
- :
- ArcGIS GeoStatistical Analyst
- :
- ArcGIS GeoStatistical Analyst Questions
- :
- geostatistical analyst-kriging
- Subscribe to RSS Feed
- Mark Topic as New
- Mark Topic as Read
- Float this Topic for Current User
- Bookmark
- Subscribe
- Mute
- Printer Friendly Page
geostatistical analyst-kriging
- Mark as New
- Bookmark
- Subscribe
- Mute
- Subscribe to RSS Feed
- Permalink
Hi all,
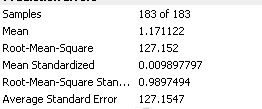
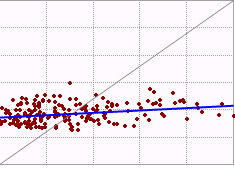
I am using IDW and Kriging in ArcGIS to explore the distribution of forest carbon stock using 183 ground sample points. The data is not normal and there is trend, so I have transformed the data. However after running kriging, the cross-validation result shows root mean square standardized: 0.98, root mean square and average standardized error: 127.7 and 128.89 respectively and the main problem is the predicted and error plot is not 1:1. Can anyone please suggest what can be the issue and how can I address this. Any helpful suggestions will be highly appreciated.
Thanks in advance!
- Mark as New
- Bookmark
- Subscribe
- Mute
- Subscribe to RSS Feed
- Permalink
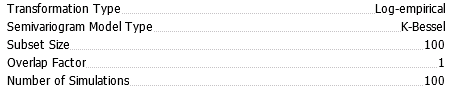
Steve, below is the detail. I played around with different model but this is the only model, where root mean square and average standardized error are equal however the predicted plot is not 1:1.
- Mark as New
- Bookmark
- Subscribe
- Mute
- Subscribe to RSS Feed
- Permalink
Try a smaller subset size and increase the overlap factor to 2 or 3
- Mark as New
- Bookmark
- Subscribe
- Mute
- Subscribe to RSS Feed
- Permalink
Hi Steve,
Thank you! I have tried with different subset size and factor but the result is not good. I have attached the measured and predicted value plot.
- Mark as New
- Bookmark
- Subscribe
- Mute
- Subscribe to RSS Feed
- Permalink
Julia
Do you have any other information that might help explain the variable that you are trying to interpolate, for example, elevation, soil depth or any other continuous variable?
If so you might want to look at cokriging.
-Steve
- Mark as New
- Bookmark
- Subscribe
- Mute
- Subscribe to RSS Feed
- Permalink
As I suggested previously...just leaving out the spatial stuff...examine any relationships/differences before looking for spatial patterns or trying to interpolate values between field observations.
- Mark as New
- Bookmark
- Subscribe
- Mute
- Subscribe to RSS Feed
- Permalink
HI all,
Thank you for all your great suggestion. I am working on elevation, soil texture and forest type as covariates, but couldn't figure out how to incorporate nominal data. I worked with other ratio covariates: population, ndvi but did not get any good result.
As Dan suggested I did some analysis in SPSS but there is no significant relation with any of these independent variables and the correlation is ow <5. I am not good in statistics, I only know basics but the descriptive result shows that standard deviation of the forest carbon stock is very high compared to mean, does that effect the result?
- Mark as New
- Bookmark
- Subscribe
- Mute
- Subscribe to RSS Feed
- Permalink
soil texture and forest type are nominal data...ie data which are classed so for example to simplify greatly without seeing your data you could perform a Chi-Squared test of classified carbon stock versus soil type.
For the benefit of others, in a greatly simplified form... data can be categorized as either: nominal (classed data), ordinal (some inherent rank between observations), interval (equal spacing between values, arbitrary zero), ratio ( interval with true zero point). There are many tests of association/difference/correlation that one can use to test for significance with data...I always recommend that these be explored before one adds the spatial dimension in...but that is my opinion. For statistical discussions I usually turn to content on Cross Validated as Stack.Exchange site devoted to data and data analysis...I include interpolation in the category of statistical analysis since at least one level, you are looking for the degree of association between observation points. Others view interpolation in your context as non-statistical but I will not quibble with their opinions here. So the advice I was trying to give you is ... understand your data, before you add the dimension of trying to fill in spatial gaps in your observations.
- « Previous
-
- 1
- 2
- Next »
- « Previous
-
- 1
- 2
- Next »