Turn on suggestions
Auto-suggest helps you quickly narrow down your search results by suggesting possible matches as you type.
Cancel
- Home
- :
- All Communities
- :
- Products
- :
- ArcGIS Explorer Online
- :
- ArcGIS Explorer Online Questions
- :
- Re: Overlapping Legend endpoints using Quantiles
Options
- Subscribe to RSS Feed
- Mark Topic as New
- Mark Topic as Read
- Float this Topic for Current User
- Bookmark
- Subscribe
- Mute
- Printer Friendly Page
Overlapping Legend endpoints using Quantiles
Subscribe
2970
3
11-10-2011 08:56 AM
11-10-2011
08:56 AM
- Mark as New
- Bookmark
- Subscribe
- Mute
- Subscribe to RSS Feed
- Permalink
If you add this service to Explorer online using add sublayer as features:
http://server.arcgisonline.com/ArcGIS/rest/services/Demographics/USA_Median_Household_Income/MapServ...
and select counties.
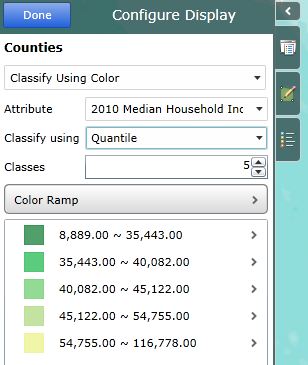
and then change the classification to Quantiles and 5 groups (don't need to change), you will notice that the end point of one group is the starting point of the next group.
This confuses me.
For example, which group is $35,443 in. Group 1 or 2.
Here are the groups:
8,889.00 ~ 35,443.00
35,443.00 ~ 40,082.00
40,082.00 ~ 45,122.00
45,122.00 ~ 54,755.00
54,755.00 ~ 116,778.00
thank you in advance,
James Cucinelli
PS I tried to attach a screenshot not sure if it worked.
http://server.arcgisonline.com/ArcGIS/rest/services/Demographics/USA_Median_Household_Income/MapServ...
and select counties.
and then change the classification to Quantiles and 5 groups (don't need to change), you will notice that the end point of one group is the starting point of the next group.
This confuses me.
For example, which group is $35,443 in. Group 1 or 2.
Here are the groups:
8,889.00 ~ 35,443.00
35,443.00 ~ 40,082.00
40,082.00 ~ 45,122.00
45,122.00 ~ 54,755.00
54,755.00 ~ 116,778.00
thank you in advance,
James Cucinelli
PS I tried to attach a screenshot not sure if it worked.
3 Replies
11-11-2011
12:18 AM
- Mark as New
- Bookmark
- Subscribe
- Mute
- Subscribe to RSS Feed
- Permalink
Hi James,
This is a known issue in the current release I'm afraid, the labelling of the classes is misleading - the maximum value in a given class is below that labelled. So in your example, the value of $35,443 is in class 2 - you should see if you find a feature that has the boundary value, it is symbolized correctly in the map with the higher group's symbol. This is on the list of things we'd like to address for the next release; however as it's not currently fixed in our working builds so I cant promise it will get fixed for the next release.
This is a known issue in the current release I'm afraid, the labelling of the classes is misleading - the maximum value in a given class is below that labelled. So in your example, the value of $35,443 is in class 2 - you should see if you find a feature that has the boundary value, it is symbolized correctly in the map with the higher group's symbol. This is on the list of things we'd like to address for the next release; however as it's not currently fixed in our working builds so I cant promise it will get fixed for the next release.
11-14-2011
03:49 AM
- Mark as New
- Bookmark
- Subscribe
- Mute
- Subscribe to RSS Feed
- Permalink
OK. Thanks.
11-14-2011
09:22 AM
- Mark as New
- Bookmark
- Subscribe
- Mute
- Subscribe to RSS Feed
- Permalink
Also, not showing the variable name being classified should be up there on the list of things to fix. These would be show-stoppers in my mind.