- Home
- :
- All Communities
- :
- Products
- :
- ArcGIS Experience Builder
- :
- ArcGIS Experience Builder Questions
- :
- Charts data do not follow Map selections; what did...
- Subscribe to RSS Feed
- Mark Topic as New
- Mark Topic as Read
- Float this Topic for Current User
- Bookmark
- Printer Friendly Page
Charts data do not follow Map selections; what did I do wrong in the action trigger?

- Mark as New
- Bookmark
- Subscribe to RSS Feed
- Permalink
I have a map of polygons (census districts in a city) and a chart on the right which displays the total population of the city classified by age groups. When it is idle, I would like to chart to display the total population of the city. However, when I select a specific polygon (a district in the city), I would like the chart to only show statistics of that district.
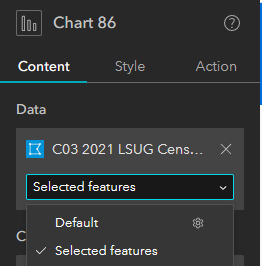
I feel that this is a simple question but I could not figure out how the action trigger should work. I have set a action trigger for my map ("record selection changes > framework > filter data records). In particular, I found that when I select "selected features" on the Chart's data, it will work but when I do not select anything on the map, nothing will show on the chart. On the other hand, when I set it to "Default", and when I select features on the map, statistics on the chart won't change (still showing the population of the city as a whole). To supplement, my chart use SUM of fields as statistics (I have a feeling that it might be relevant).

Very grateful for your help!


- Mark as New
- Bookmark
- Subscribe to RSS Feed
- Permalink
Hi @tcyd ,
> " When it is idle, I would like to chart to display the total population of the city. However, when I select a specific polygon (a district in the city), I would like the chart to only show statistics of that district. "
Based on your description here is my suggestion:
1. In Chart widget configuration, just use "Default" data view in data source. So that when idle (no specific selection), chart can show statistic of the whole city.
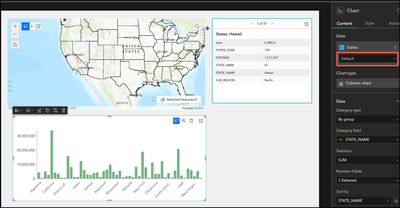
2. In Map widget, go to Action setting. Select "Record selection changes" - "Framework"- "Filter data records". Set the trigger data and action data to the same one (your census districts polygon). Then at runtime, you should be able to select a district and then see the chart update showing statistic only for that district.

Thanks,
Wei
