- Home
- :
- All Communities
- :
- Products
- :
- ArcGIS Enterprise
- :
- ArcGIS Enterprise Questions
- :
- In which sense the pooling settings affect the per...
- Subscribe to RSS Feed
- Mark Topic as New
- Mark Topic as Read
- Float this Topic for Current User
- Bookmark
- Subscribe
- Mute
- Printer Friendly Page
In which sense the pooling settings affect the performance of displaying services when consumed?
- Mark as New
- Bookmark
- Subscribe
- Mute
- Subscribe to RSS Feed
- Permalink
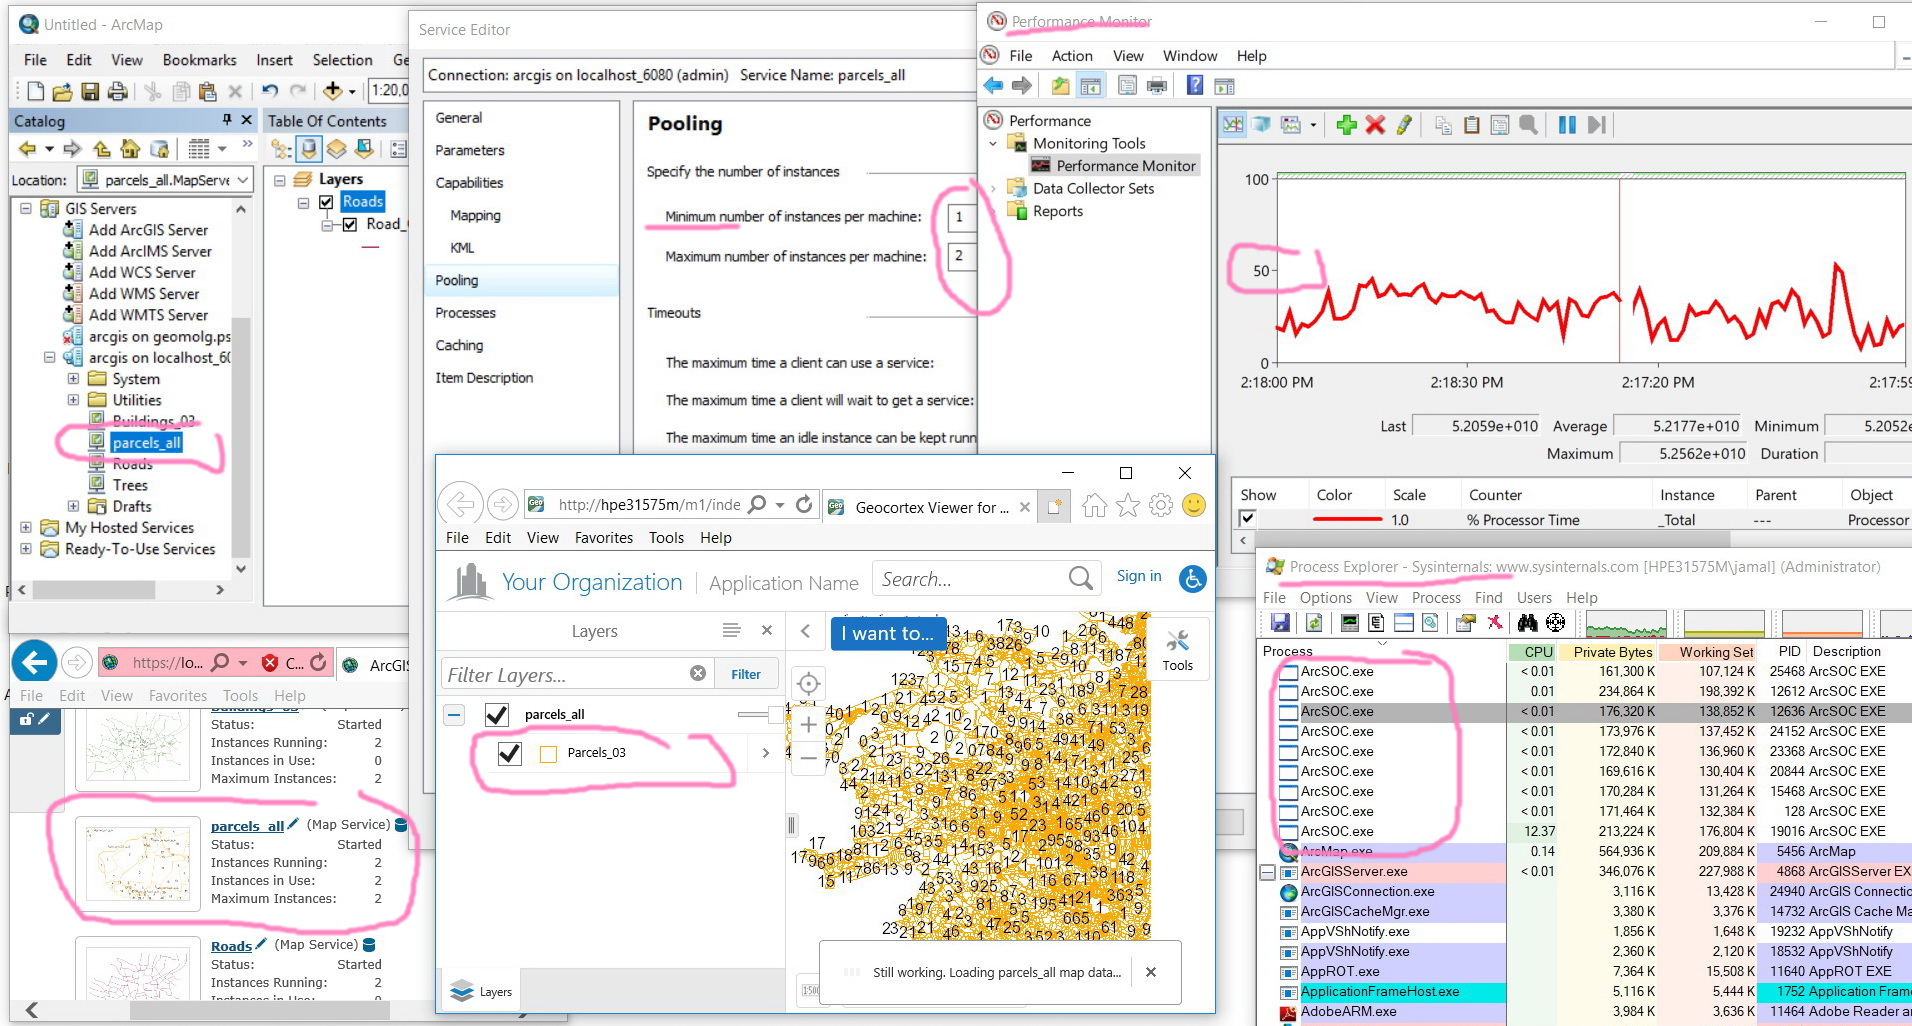
In which sense the pooling settings affect the performance of displaying services when consumed?
For example, for the service indicated in the screenshot below, “the maximum number of instances per machine” is set to be 7. Does this mean that the if we have 9 CONCURRENT (simultaneous) users, then 7 of them will be able to display the service while the other two will be waiting?
Thank you
Best regards
Jamal

Jamal Numan
Geomolg Geoportal for Spatial Information
Ramallah, West Bank, Palestine
- Mark as New
- Bookmark
- Subscribe
- Mute
- Subscribe to RSS Feed
- Permalink
Sorry 'Task Manager' (WIndows Task Manager) does not display the time that each process started (My mistake).
You can get this information via Powershell
Get-WmiObject win32_process | Select-Object Name, ProcessId, WorkingSetSize, HandleCount, ThreadCount, CreationDate, KernelModeTime, UserModeTime, Commandline |Out-GridView
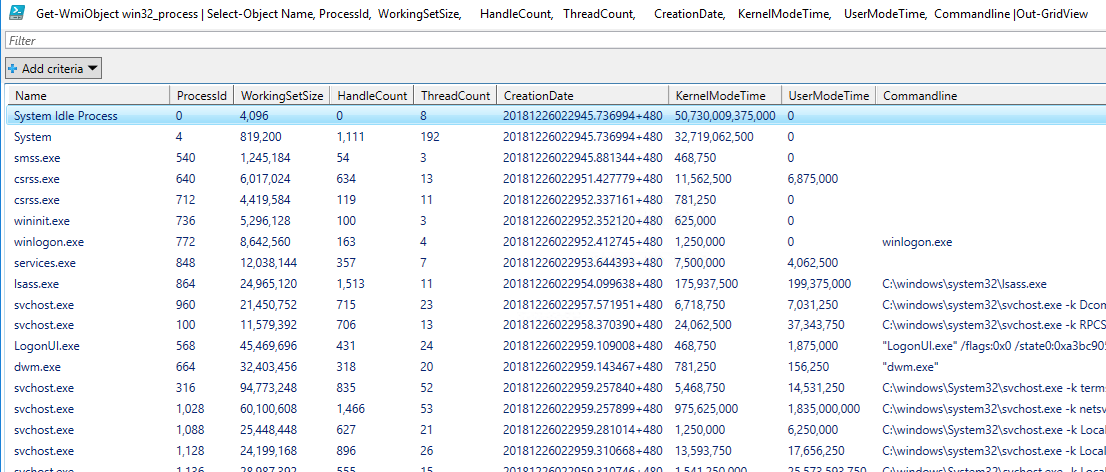
In your case all the ArcSOC CreationDates should be around midnight last night. If there are other start times then, while that start was occuring, there will be an elongated response for the request that caused the start and potentially elongated responses for other requests that arrive while the start is being actioned.
To chase why you have start times away from midnight you need to look at the ArcGIS logs
Firstly to verify that you are capturing the logs you should be able to find the following entries around midnight
| Datetime | Type | Code | Message |
| 28/12/2018 0:00 | INFO | 8000 | Instance of service 'Utilities/PrintingTools' has been created successfully. |
| 28/12/2018 0:00 | INFO | 8000 | Instance of service 'System/PublishingToolsEx' has been created successfully. |
| 28/12/2018 0:00 | INFO | 8000 | Instance of service 'System/SpatialAnalysisTools' has been created successfully. |
| 28/12/2018 0:00 | INFO | 8000 | Instance of service 'System/SpatialAnalysisTools' has been created successfully. |
If you cannot see them then you probably have logging set to 'Warning' or 'Severe'. Try setting the level to 'Info' . There is a performance impact doing this, but we run with it set to 'FINE' and we process over 2 million requests per day without significant impact.
We run with 'FINE' so that we can get request response times..
| Datetime | Source | MethodName | Type | Code | Elapsed |
| 28/12/2018 0:00 | Utilities/Geometry.GeometryServer | /simplify | FINE | 100004 | 0.0029 |
| 28/12/2018 0:00 | Utilities/Geometry.GeometryServer | /simplify | FINE | 100004 | 0.0008 |
| 28/12/2018 0:00 | External/Imagery_External.MapServer | WMSServer.GetToPost | FINE | 100002 | 0.00064 |
| 28/12/2018 0:00 | External/Imagery_External.MapServer | WMSServer.get_Data | FINE | 100004 | 0.57157 |
| 28/12/2018 0:01 | Utilities/Geometry.GeometryServer | /simplify | FINE | 100004 | 0.00162 |
| 28/12/2018 0:01 | Utilities/Geometry.GeometryServer | /simplify | FINE | 100004 | 0.00093 |
| 28/12/2018 0:01 | External/Mineral_External.MapServer | WMSServer.GetToPost | FINE | 100002 | 0.00056 |
| 28/12/2018 0:01 | External/Mineral_External.MapServer | WMSServer.get_Data | FINE | 100004 | 0.15819 |
| 28/12/2018 0:01 | External/Imagery_External.MapServer | WMSServer.GetToPost | FINE | 100002 | 0.00035 |
| 28/12/2018 0:01 | External/Imagery_External.MapServer | WMSServer.get_Data | FINE | 100004 | 0.47298 |
| 28/12/2018 0:01 | External/Imagery_External.MapServer | WMSServer.GetToPost | FINE | 100002 | 0.00066 |
| 28/12/2018 0:01 | External/Imagery_External.MapServer | WMSServer.get_Data | FINE | 100004 | 0.21022 |
| 28/12/2018 0:01 | External/Mineral_External.MapServer | WMSServer.GetToPost | FINE | 100002 | 0.00109 |
You can get similar response data from the IIS logs on the server. As an aside, in regards to your query on tiles, we see the request in the IIS logs, but do not see any stats in the ArcGIS logs. My (uneducated) assumption is that ESRI decided to bypass any logging for TILES in the interests of making it as fast as possible.
We have actually gone to the effort of collecting the IIS and ArcGIS logs into Splunk and then displaying the overheads visually..
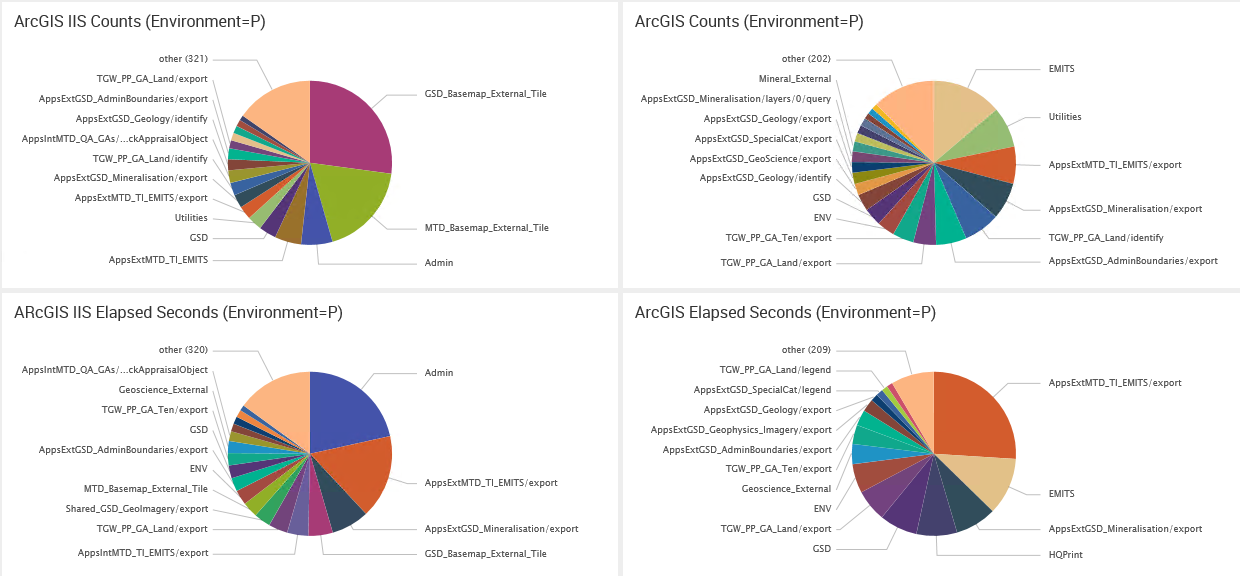
The left column is from the IIS logs, the right column is from the ArcGIS logs
The top row is showing the number of requests, the bottom row is showing how long those requests took.
The tile counts in the top left hand chart are the most significant, but become insignificant from an elapsed perspective (and are not shown at all from an ArcGIS perspective).
We did all this work on earlier versions of ArcGIS, hopefully the instrumentation provided by ESRI in the newer versions is more useful (although nothing beats looking at the raw data yourself)
- Mark as New
- Bookmark
- Subscribe
- Mute
- Subscribe to RSS Feed
- Permalink
ArcGIS Monitor ArcGIS Monitor | Optimize Your Enterprise GIS is the best tool for you.
It cost money and it is not simple to install and set but it will give you full information about what each service is doing, how much CPU, memory etc each service takes.
You should look into it.
- Mark as New
- Bookmark
- Subscribe
- Mute
- Subscribe to RSS Feed
- Permalink
There could be factors outside ArcGIS Server that affect response times. For instance, when my organization migrated to a new data center, we would have periods of time where server response times were slower. For all the troubleshooting we did, we could not figure out why the slow periods were occurring for months. We finally determined that a network interconnect in the data center between our servers and the rest of the world, both internal and external networks, was incorrectly sized when the data center was built out. The slow periods were do to what other groups were doing on the network, and the switch would get so bogged down that server response times went up across the board.
Beyond exploring your network topology and performance more, I would also take a deeper dive into specific requests that are running during the slow periods. If you have some users, scripts, etc... that are running slow-running REST calls; those could tie up SOCs and cause slower response times for simple map requests. We had an issue where a web app was configured to filter results to a specific fiscal year, but yet the field with the fiscal year was not indexed. With millions of records, a full-table scan was being run each time people would hit the service using that web app. When the app got used by a lot of users, we had so many SOCs constantly hitting that same feature class and doing full-table scans, the response times would creep up. I was surprised the response times stayed under 5 seconds, but I guess that it a testament to how fast computers are these days.
What I constantly push back on in my organization is that ArcGIS Server cannot turn poorly tuned data or configured map documents into lightning fast GIS services. It is usually under load when the issues start to show themselves.
- Mark as New
- Bookmark
- Subscribe
- Mute
- Subscribe to RSS Feed
- Permalink
Thank you guys for the useful input.
I have already commented with the following on another thread.
This issue here is that there is no math equation based on which one can decide the min\max number of instances (ArcSOC.exe) needed for each published service.
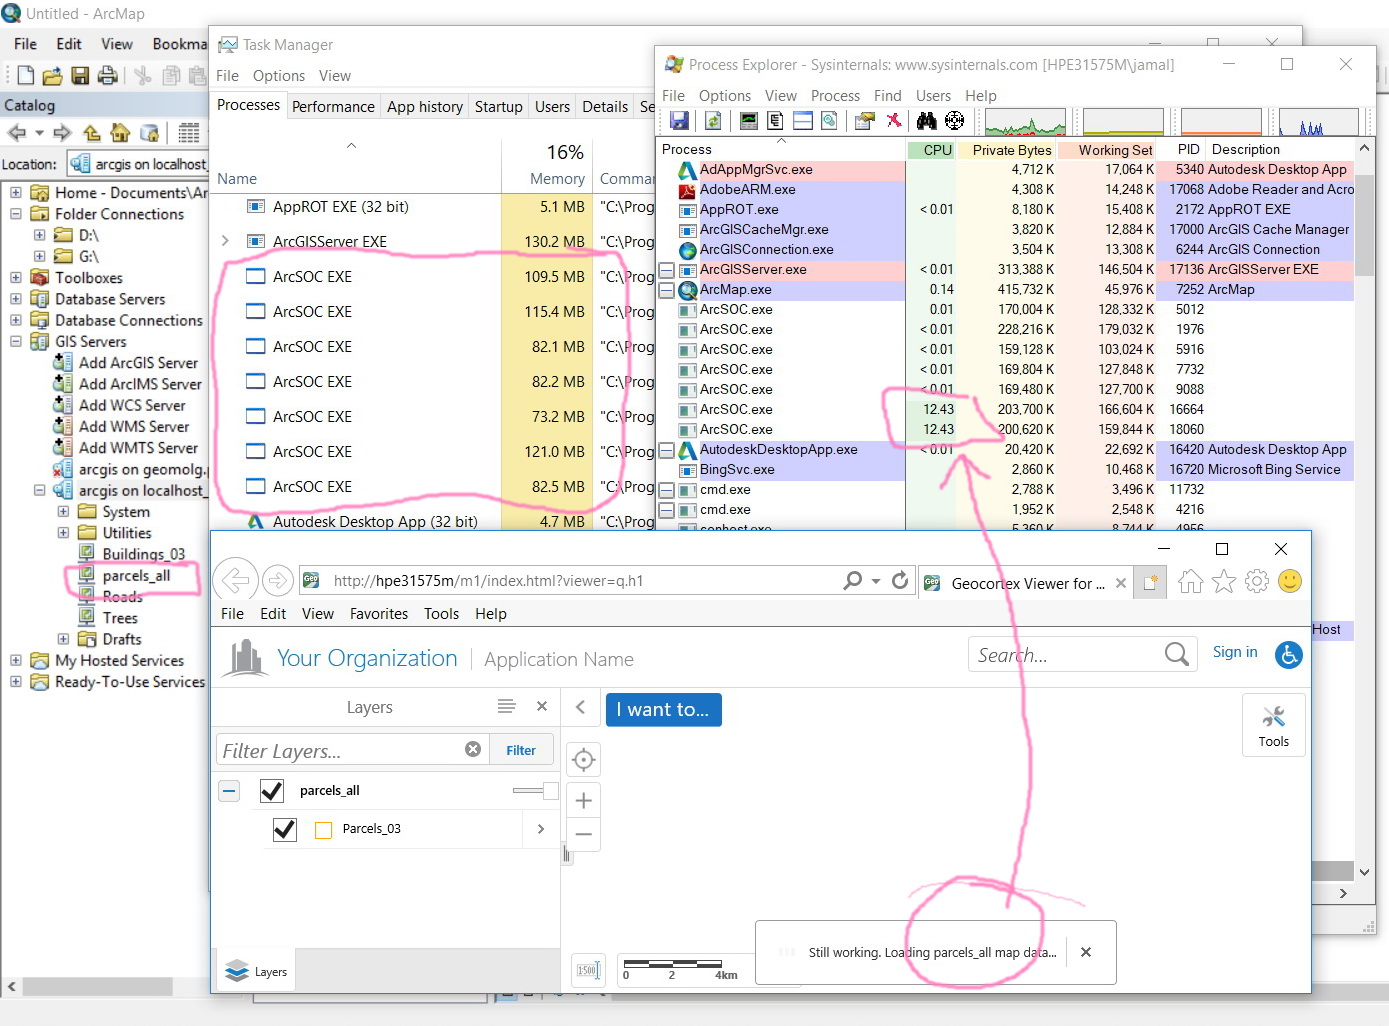
In a test environment, we have been trying to understand service performance when executing actions such as panning, zooming, quiring, etc. We found out that, for example, zooming a service that contains a layer of 300,000 polygons is really a heavy action and would consume around 12% of the CPU (machine specs: 3GHz CPU, 4 Cores, 64 GB RAM, 2133 MHz). This means that if 10 users are zooming at the same time, then the CPU will get full just from zooming action on a service!
Zooming actions consumes on a service 12% of the CPU
Each ArcSoc.exe occupies around 80 MB on the RAM
Then imagine that we have 100 or 1000 users are zooming at the same time. Does this lead to the fact that no any server what the specs are will be sufficient to take care of services?
The issue gets complicated to be explained if we wanted to know how actions (such as pan, zoom, query, etc.) are translated in terms of requests, and then to figure out the number of ArcSoc.exe needed to serve these requests\actions
This could explains why our web mapping application fails at peak hours!

Jamal Numan
Geomolg Geoportal for Spatial Information
Ramallah, West Bank, Palestine
- Mark as New
- Bookmark
- Subscribe
- Mute
- Subscribe to RSS Feed
- Permalink
Does this lead to the fact that no any server what the specs are will be sufficient to take care of services?
If by "any" you mean one, a single server, then the answer is yes (or do I mean to say no). To rephrase, it is common to need more than one GIS server, which is why Esri supports a multi-machine deployment model.
In my organization, our ArcGIS Server site that hosts the highest-demand GIS services is made up of 6 GIS servers and 2 web adaptors. Typically all 6 machines run around 40% total CPU utilization spiking to 90% at times.
Have you run the MXD through PerfQAnalyzer: New 10.6/10.6.x Version (Build 173) Available for Download ? Slow redraw times from the data tier will translate through to slow redraw times in the GIS service. There are numerous performance-related configuration aspects to GIS services themselves. How is this service configured, e.g., are you caching at all ?
- Mark as New
- Bookmark
- Subscribe
- Mute
- Subscribe to RSS Feed
- Permalink
Thank you Joshua for the help. The points you have indicated are very useful
Best
Jamal
Jamal Numan
Geomolg Geoportal for Spatial Information
Ramallah, West Bank, Palestine
- « Previous
-
- 1
- 2
- Next »
- « Previous
-
- 1
- 2
- Next »