- Home
- :
- All Communities
- :
- Products
- :
- ArcGIS Enterprise
- :
- ArcGIS Enterprise Questions
- :
- In which sense the pooling settings affect the per...
- Subscribe to RSS Feed
- Mark Topic as New
- Mark Topic as Read
- Float this Topic for Current User
- Bookmark
- Subscribe
- Mute
- Printer Friendly Page
In which sense the pooling settings affect the performance of displaying services when consumed?
- Mark as New
- Bookmark
- Subscribe
- Mute
- Subscribe to RSS Feed
- Permalink
In which sense the pooling settings affect the performance of displaying services when consumed?
For example, for the service indicated in the screenshot below, “the maximum number of instances per machine” is set to be 7. Does this mean that the if we have 9 CONCURRENT (simultaneous) users, then 7 of them will be able to display the service while the other two will be waiting?
Thank you
Best regards
Jamal

Jamal Numan
Geomolg Geoportal for Spatial Information
Ramallah, West Bank, Palestine
- Mark as New
- Bookmark
- Subscribe
- Mute
- Subscribe to RSS Feed
- Permalink
Hi
A display request should take less the 1 second.
If 9 requests will come in the same second then 7 will be processed by 7 SOC's and the other 2 will wait for one second.
In real life if the display is tune up then 2 instances will be more then you need.
If a user ask for 4 pan/zoom operation in a minute then 10 users create 40 requests in a minute and 1 SOC is about 66% busy. In that rate even one should do the work.
- Mark as New
- Bookmark
- Subscribe
- Mute
- Subscribe to RSS Feed
- Permalink
Hi Mody
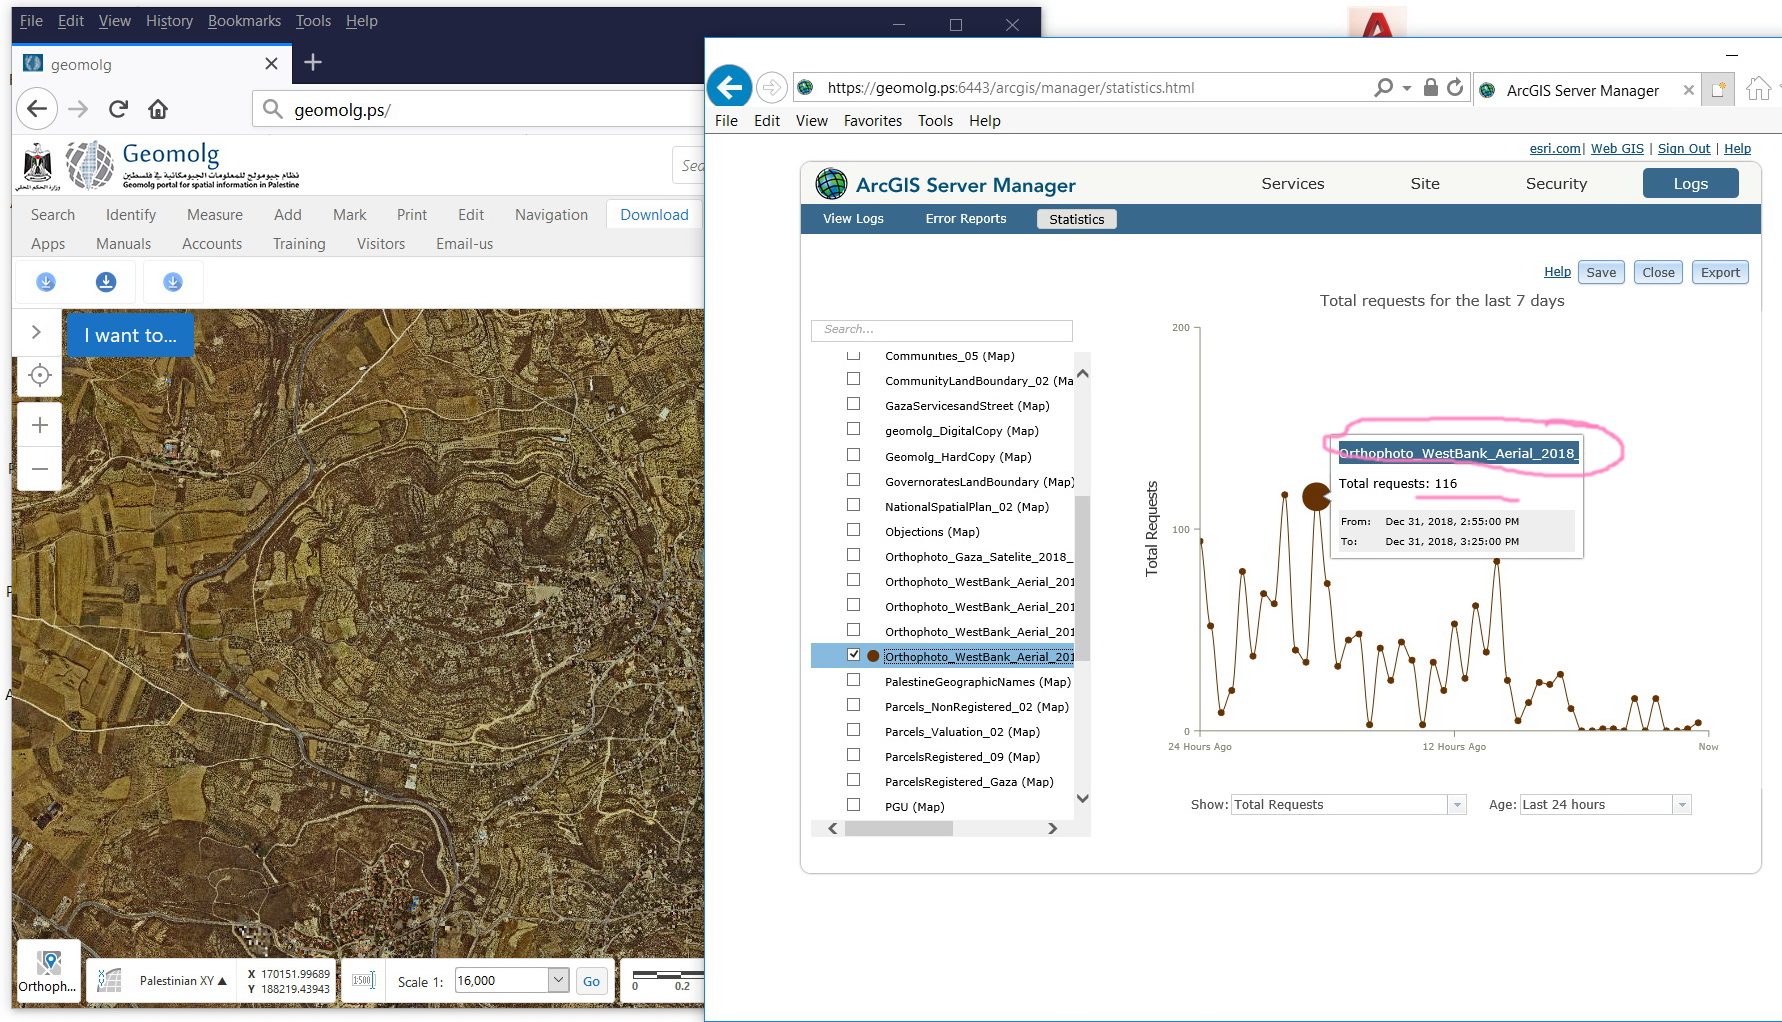
As I understand from you that the maximum response time will not exceed one second for displaying service, but I monitor my services by statistics tool and I found that the maximum response time for some services is more than that, please see screenshot below that show the response time is about 30 second for my service.
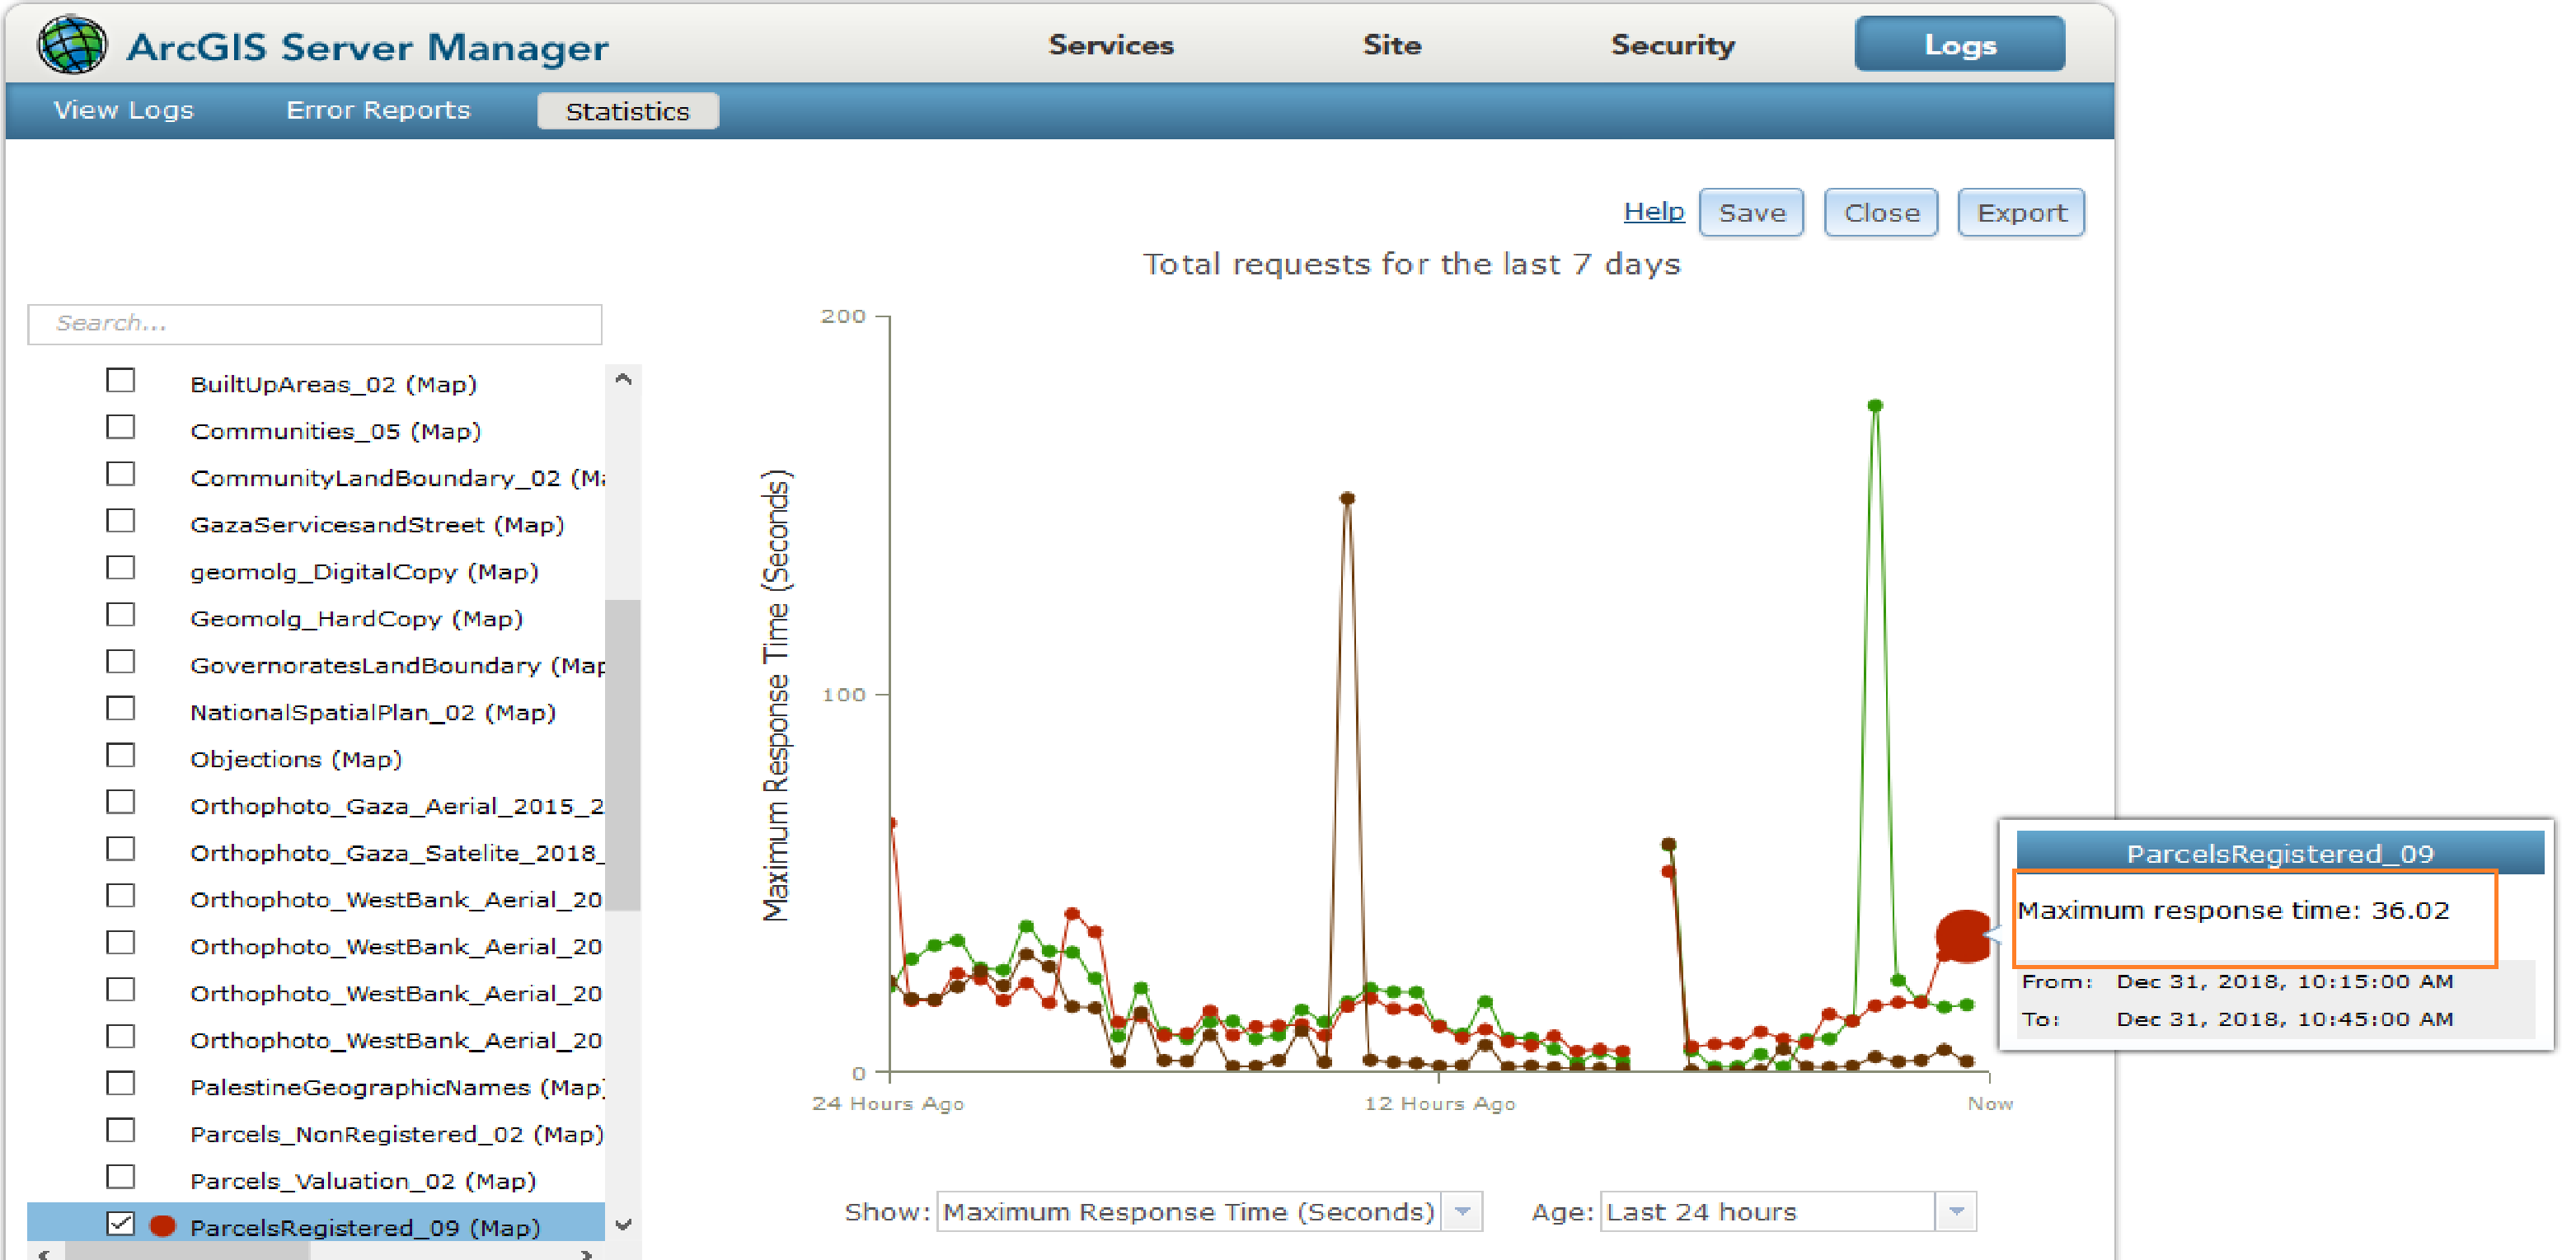
What do you think?
Best
Abdullah
- Mark as New
- Bookmark
- Subscribe
- Mute
- Subscribe to RSS Feed
- Permalink
Very hard to say by this information.
Not all requests must be display, if you did some query or run GP tool it might take much longer.
If the machine was busy doing something else (for example copy a lot of data to the disk that the service is using) it can slow things.
From your graph it looks like the system is fine most of the time. You need to find out what happened in these pick times.
- Mark as New
- Bookmark
- Subscribe
- Mute
- Subscribe to RSS Feed
- Permalink
Thanks for your reply
Actually, I am monitoring my Server also, and I feel that everything going well, screenshot below show normal values when High response time happened for the services.
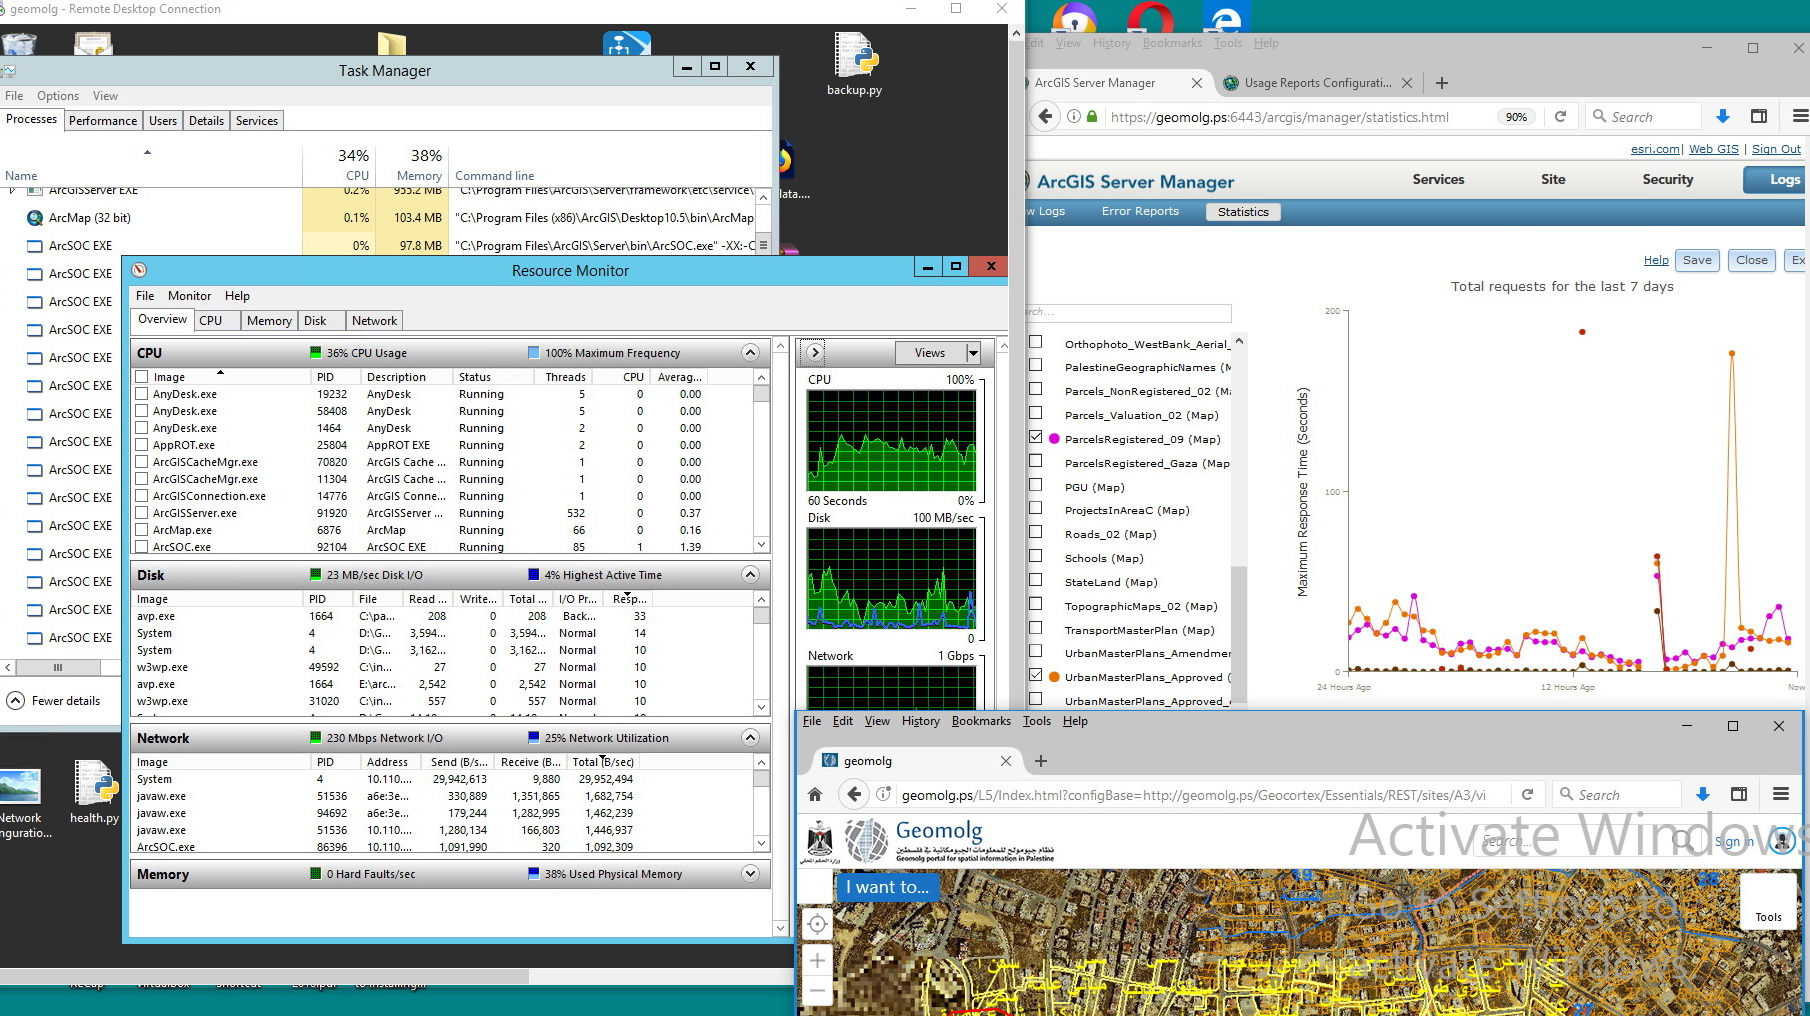
What do you expect?
Best
Abdullah
- Mark as New
- Bookmark
- Subscribe
- Mute
- Subscribe to RSS Feed
- Permalink
Many thanks Mody for the input.
It is really very confusing why displaying services in our web mapping application gets slow at sometime during the day. The Windows resources monitor doesn’t indicate any up normal usage for CPU, RAM, HD or Network.
The other issue is that, we couldn’t figure out how the number of requests are associated to:
Response time
ArcSoc.exe
CPU, RAM, HD, Network
In other words, we have no definite clue why ArcGIS Server fails to display services with an acceptable response time.


Jamal Numan
Geomolg Geoportal for Spatial Information
Ramallah, West Bank, Palestine
- Mark as New
- Bookmark
- Subscribe
- Mute
- Subscribe to RSS Feed
- Permalink
You had 26500 requests in half an hour. That is almost 900 a minute. This is why your response time is high.
There is no way for even 100 users to create such load (9 request per user per minute?). You need to find what created this load.
Possibly a program somewhere that create this load.
- Mark as New
- Bookmark
- Subscribe
- Mute
- Subscribe to RSS Feed
- Permalink
Many thanks for the prompt answer Mody
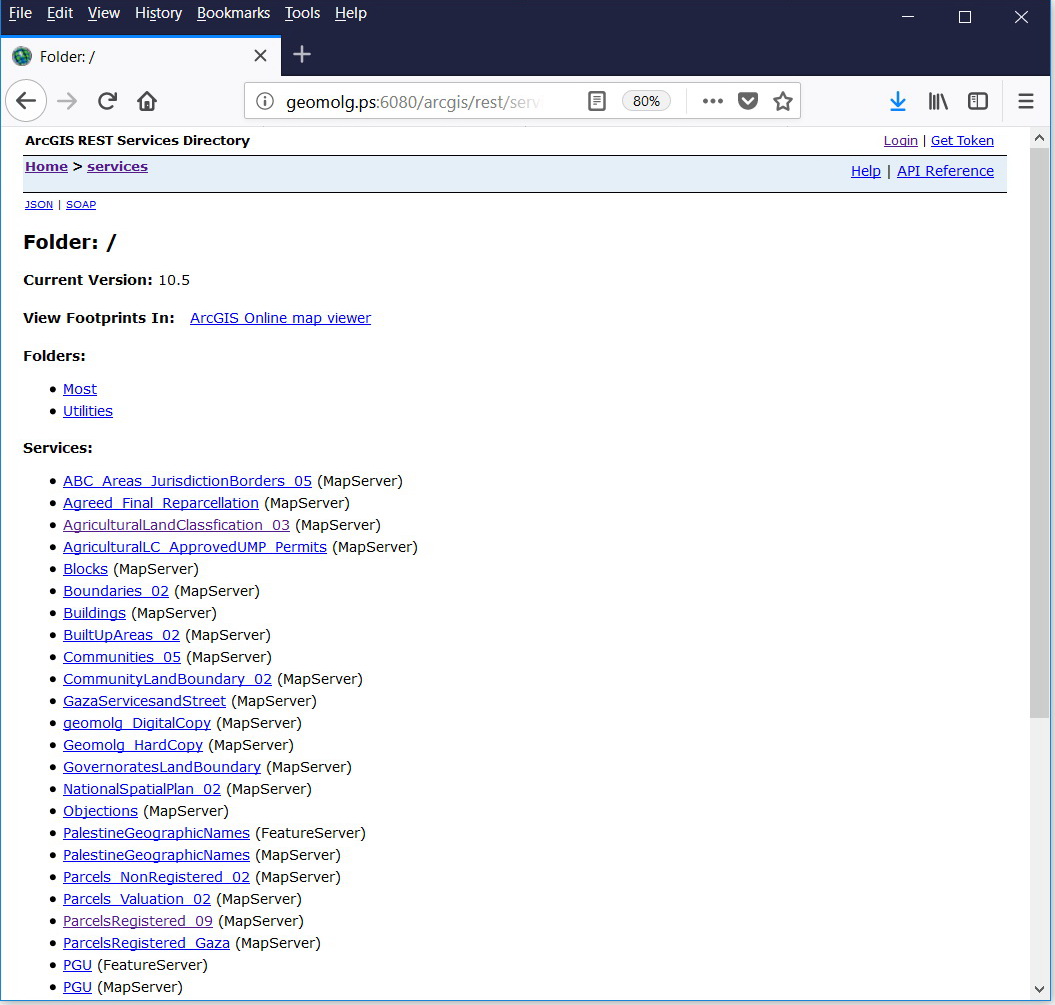
Our services are open to public through the link below:
http://geomolg.ps/services.html
- Now, we decided to lock all of services and thus users are exclusively able to display them through our web mapping application.
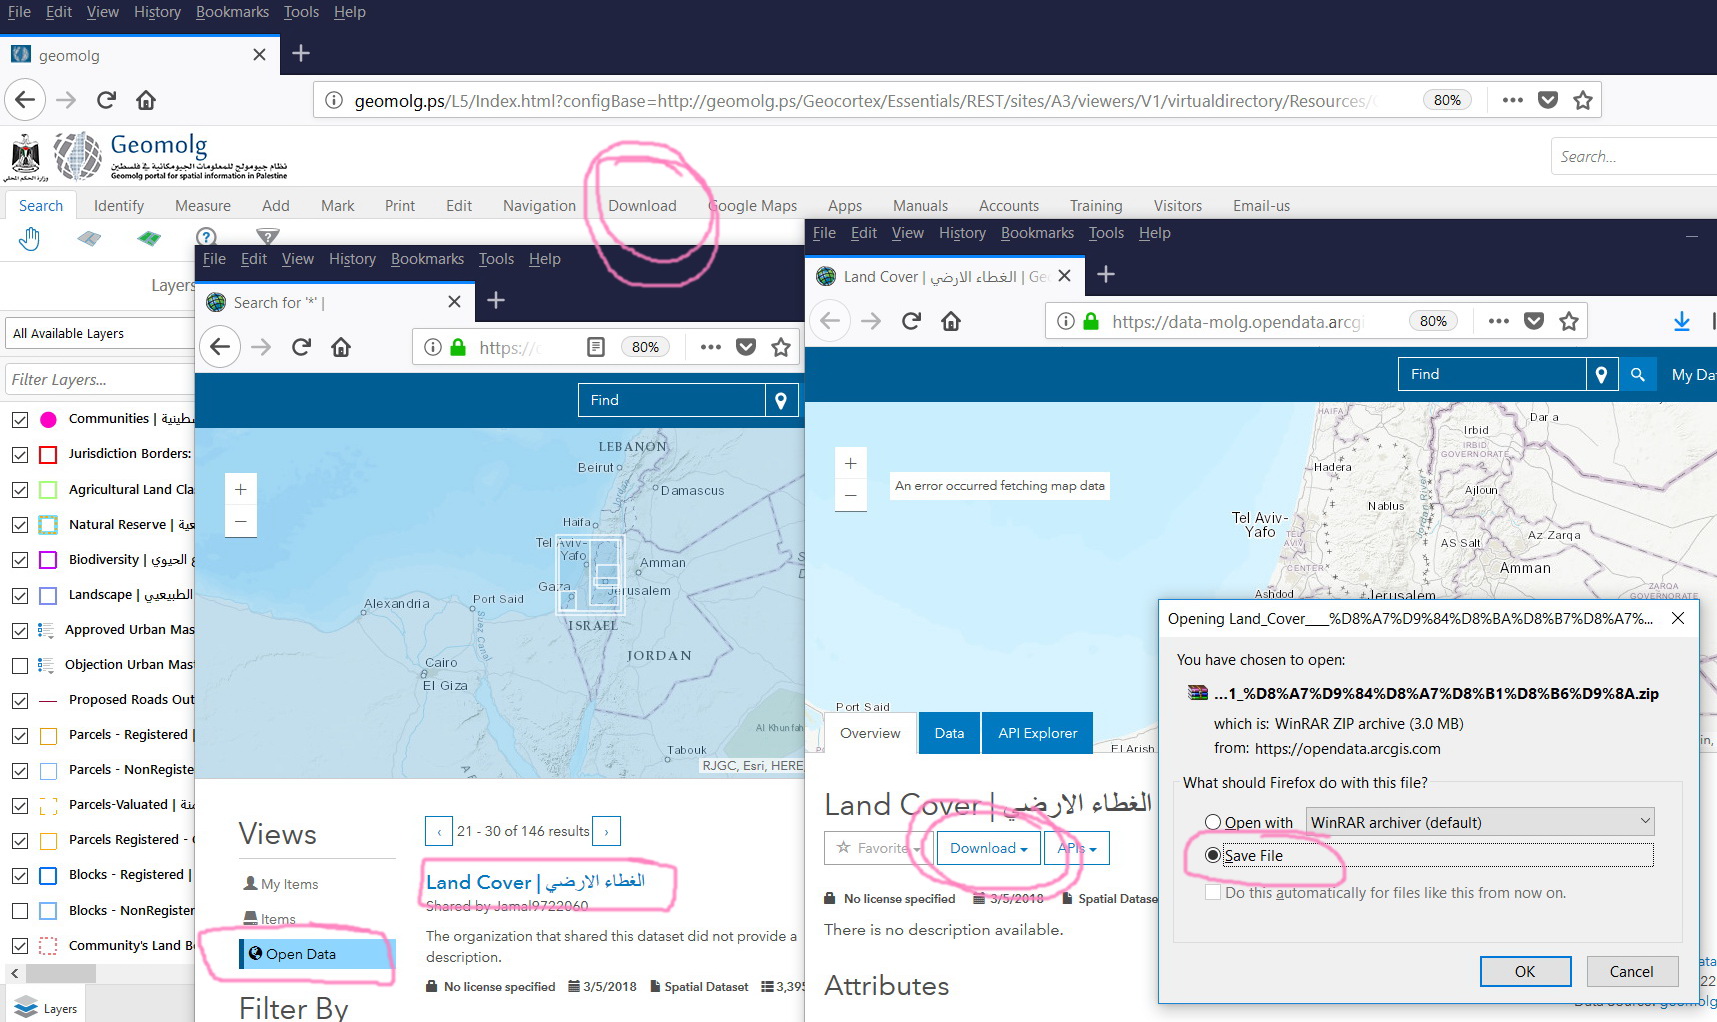
- Also, these services are downloadable through our application as they are all configured in the ArcGIS Open data
- Further, users are used to consume cached imageries and extract them using QGIS!
I’ll be monitoring and see if this will decrease the request.
But eventually, how the number of Requests are related to the number of ArcSOC available? Does increasing the min\max number of ArcSoc help?
We observed also that the cached imagery has low number of requests despite the fact that it is the most displayed one! How this can be explained?
Jamal Numan
Geomolg Geoportal for Spatial Information
Ramallah, West Bank, Palestine
- Mark as New
- Bookmark
- Subscribe
- Mute
- Subscribe to RSS Feed
- Permalink
One possible explanation for long response times (20+ seconds) is that your mapservices are starting/stopping. This process can take multiple seoconds (and even minutes if you have lots of layers). You can check to see if this is happening by reviewing the ArcGIS logs (a subject in itself) or you could check 'Task Manager' on the ArcGIS server to see when each ArcSOC started. The configuration that works for us is to set MIN/MAX Instance to the same value and to set the services to recycle every 24 hours between midnight and 1AM. If we get any Mapservice recycling during the day we investigate root cause and correct.
- Mark as New
- Bookmark
- Subscribe
- Mute
- Subscribe to RSS Feed
- Permalink
Many thanks John for the input.
- Most of our services are set as 1 for min and 2 as max
- The recycle is set to be 24
- I don’t see anything unusual in the logs
- May you please help me how to go to the Task Manager of ArcGIS Server?
What other things I need to consider?


Jamal Numan
Geomolg Geoportal for Spatial Information
Ramallah, West Bank, Palestine