- Home
- :
- All Communities
- :
- Products
- :
- ArcGIS Enterprise
- :
- ArcGIS Enterprise Questions
- :
- Re: Cache tiles not present at determined scale
- Subscribe to RSS Feed
- Mark Topic as New
- Mark Topic as Read
- Float this Topic for Current User
- Bookmark
- Subscribe
- Mute
- Printer Friendly Page
- Mark as New
- Bookmark
- Subscribe
- Mute
- Subscribe to RSS Feed
- Permalink
I created tiles where the maximum cached scale was determined at 1:564.248588 but when checking the service in ArcMap we are not able to see anything at this scale. The maximum scale where we were able to see features is 1:847 altought the next defined scale is 1:1128.497176. We ran the process to recreate tiles several times having the same results every time. Any suggestions or comments are appreciate.
Solved! Go to Solution.
Accepted Solutions
- Mark as New
- Bookmark
- Subscribe
- Mute
- Subscribe to RSS Feed
- Permalink
Here's what I usually do for the scale ranges in the map document:
For the data I want shown at 1:564.248588 - I set the max to 0 and the min to 800.
For the data I want shown at 1:1128.497176 - I set the max to 801 and the min to 1600.
Etc.
I tend to round up or down and pick an integer that falls roughly in the middle between 2 scales.
- Mark as New
- Bookmark
- Subscribe
- Mute
- Subscribe to RSS Feed
- Permalink
Hi Ulises,
Does you map document used to create the service have a visible range for certain scales?
If you look at the service properties, do you have it set to use the ArcGIS Online tiling scheme and scales?
- Mark as New
- Bookmark
- Subscribe
- Mute
- Subscribe to RSS Feed
- Permalink
Hi Jennifer,
the group layer defined for this scale is set to 564 as minimum scale. Previous group is set to minimum 1129 and max 565...In ArcMap I can see the layers at the defined scales but not when using the service.
564
1128
2257
4514
...
Thanks
- Mark as New
- Bookmark
- Subscribe
- Mute
- Subscribe to RSS Feed
- Permalink
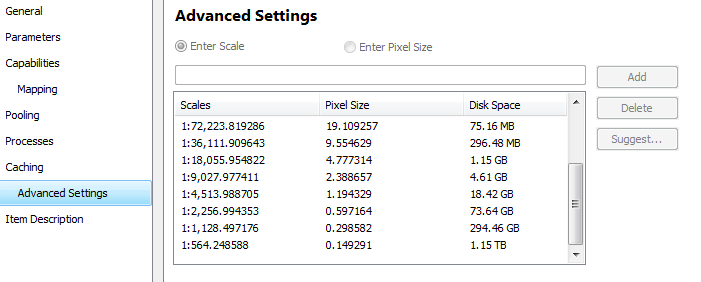
If you open the service properties and go to Caching -> Advanced Settings, can you take a screen capture of the scales listed.
Ex;
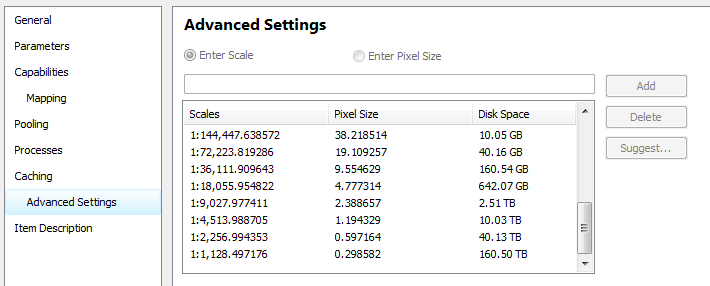
I would also consider setting the min and max scales to values around the scales you want the data to show at. If you set it for the exact scale value, it can cause problems.
For example, if your layer for the 1:564 ArcGIS Online scale has a minimum scale of 564 in the map document, it will not show when cached. I believe the actual scale value is something like 1:564.249 - which is beyond 564.
- Mark as New
- Bookmark
- Subscribe
- Mute
- Subscribe to RSS Feed
- Permalink
To set the scales in ArcMap I loaded a file with the defined scales, yet ArcMap don't show the actual value (decimals), just the integer numbers. I there a way around this? Thanks for your help and suggestions...
- Mark as New
- Bookmark
- Subscribe
- Mute
- Subscribe to RSS Feed
- Permalink
Here's what I usually do for the scale ranges in the map document:
For the data I want shown at 1:564.248588 - I set the max to 0 and the min to 800.
For the data I want shown at 1:1128.497176 - I set the max to 801 and the min to 1600.
Etc.
I tend to round up or down and pick an integer that falls roughly in the middle between 2 scales.