Turn on suggestions
Auto-suggest helps you quickly narrow down your search results by suggesting possible matches as you type.
Cancel
- Home
- :
- All Communities
- :
- Products
- :
- ArcGIS Enterprise
- :
- ArcGIS Enterprise Portal Questions
- :
- Re: XY data with date and time references for vert...
Options
- Subscribe to RSS Feed
- Mark Topic as New
- Mark Topic as Read
- Float this Topic for Current User
- Bookmark
- Subscribe
- Mute
- Printer Friendly Page
XY data with date and time references for vertexes - need to make a line
Subscribe
6724
12
10-18-2013 09:20 AM
10-18-2013
09:20 AM
- Mark as New
- Bookmark
- Subscribe
- Mute
- Subscribe to RSS Feed
- Permalink
- Report Inappropriate Content
I have some data as follows:
INDEX RCR UTC DATE UTC TIME LOCAL DATE LOCAL TIME MS VALID LATITUDE N/S LONGITUDE E/W HEIGHT SPEED Distance
1 T 9/27/2013 15:24:34 9/27/2013 8:24:34 0 SPS 46.299584 N -105.973519 W 832 m 0.059 km/h 0.00 m
2 T 9/27/2013 15:25:34 9/27/2013 8:25:34 0 SPS 46.299511 N -105.973503 W 835 m 0.003 km/h 0.00 m
3 T 9/27/2013 15:26:34 9/27/2013 8:26:34 0 DGPS 46.299497 N -105.973463 W 838 m 0.027 km/h 8.27 m
What they would like is a line with graduated colors so they can tell the route the cow took in their travels. They are putting a GPS unit on cows on Tuesday and removing them Friday so each file has about 1713 lines of data. I would like to make a line with points and somehow number the points or make a graduated line that turns from say red to blue so they can tell where they started and ended and how long they stayed at certain points. Any ideas would be greatly appreciated!
Thanks,
Diona
12 Replies
10-18-2013
10:13 AM
- Mark as New
- Bookmark
- Subscribe
- Mute
- Subscribe to RSS Feed
- Permalink
- Report Inappropriate Content
This could be as simple as creating symbology using the FID of the segments in the Value Field (assuming that the order is first to last timewise), then using something like the green to red colour ramp
10-20-2013
03:21 PM
- Mark as New
- Bookmark
- Subscribe
- Mute
- Subscribe to RSS Feed
- Permalink
- Report Inappropriate Content
Look at using "points to line" tool. Then create points using "vertices to point" tool.
You will need to calculate how long cow was at each point for time spent at each point. Time sampling period is going to be an issue. As cows may move location, but the movement isn't picked up (i.e. they will just be found at a new location without a 'speed' of movement). Resolution of data can be an issue. In your sample over 2 minutes the cows moved 3 times but only once over a distance of 8m
Is there an option to filter data?
Regards,
Craig
10-22-2013
07:50 AM
- Mark as New
- Bookmark
- Subscribe
- Mute
- Subscribe to RSS Feed
- Permalink
- Report Inappropriate Content
I hope I can respond without to much confusion.
You have a unique identifier for each cow? I will assume the sample data you posted is for one cow for this.
I will use the local time. I reformatted your data in excel such that
Local Date is column E formatted as date
Locat Time is Column F formatted as time
Latitude is I
Longitude is J
Distance ended up in column M (but will not be used)
I added 3 new columns
LatitudeTO in column N
LongitudeTO in column O
TimeAtLocation in column P
Assuming your data is sorted by date and time earliest to latest and all data is for a single cow.
In cell N2 (LatitudeTO) put in =I3
In cell O2 put in =J3
In cell P2 put =f3-f2
These will populate your to X,Y and time a location 1
Drag these formulas down to the bottom of the spreadsheet.
Now save your data a .csv this is important because it will embed the formulas as actual data.
Open your .csv up and delete the last entry. There will be no to x,y or time at this point because it is the destination.
bring your .csv into your ArcGIS and use the X,Y to line and the Lat and Long attributes.
After your done you can also generate a point feature from the same table with the original lat long. You can symbolize the points with the time at location attribute.
Keep spaces out of the column headers to make things smoother. Also, remove the W and N designations and make sure there are no spaces in the lat long columns.
I have some data as follows:
INDEX RCR UTC DATE UTC TIME LOCAL DATE LOCAL TIME MS VALID LATITUDE N/S LONGITUDE E/W HEIGHT SPEED Distance
1 T 9/27/2013 15:24:34 9/27/2013 8:24:34 0 SPS 46.299584 N -105.973519 W 832 m 0.059 km/h 0.00 m
2 T 9/27/2013 15:25:34 9/27/2013 8:25:34 0 SPS 46.299511 N -105.973503 W 835 m 0.003 km/h 0.00 m
3 T 9/27/2013 15:26:34 9/27/2013 8:26:34 0 DGPS 46.299497 N -105.973463 W 838 m 0.027 km/h 8.27 m
What they would like is a line with graduated colors so they can tell the route the cow took in their travels. They are putting a GPS unit on cows on Tuesday and removing them Friday so each file has about 1713 lines of data. I would like to make a line with points and somehow number the points or make a graduated line that turns from say red to blue so they can tell where they started and ended and how long they stayed at certain points. Any ideas would be greatly appreciated!
Thanks,
Diona
03-18-2014
02:15 PM
- Mark as New
- Bookmark
- Subscribe
- Mute
- Subscribe to RSS Feed
- Permalink
- Report Inappropriate Content
[ATTACH=CONFIG]32291[/ATTACH]
I did what you suggested, but still have problems when I use XY to line. I'm attaching the results to see if you can spot what I am doing wrong. Where I question myself is in the setup box, I'm not sure what to use for beginning and ending.
Thanks,
Diona
I did what you suggested, but still have problems when I use XY to line. I'm attaching the results to see if you can spot what I am doing wrong. Where I question myself is in the setup box, I'm not sure what to use for beginning and ending.
Thanks,
Diona
03-18-2014
03:22 PM
- Mark as New
- Bookmark
- Subscribe
- Mute
- Subscribe to RSS Feed
- Permalink
- Report Inappropriate Content
Data needs to be structured so that coords for point 1 are starting Lat_S and Lon_S and point 2 coords are Lat_E and Lon_E.
INDEX LOCAL_DATE LOCAL_TIME LATITUDE_S LONGITUDE_S LATITUDE_E LONGITUDE_E
1 9/27/2013 8:24:34 46.299584 -105.973519 46.299511 -105.973503
2 9/27/2013 8:25:34 46.299511 -105.973503 46.299497 -105.973463
3 9/27/2013 8:26:34 46.299497 -105.973463 46.299497 -105.973463
You need to connect from one point to the next and double up your last coord to end the connections.
Start X = Lon_S
Start Y = Lat_S
End X = Lon_E
End Y = Lat_E
Even those these tools should work with CSV or Tables in GDB I have found the odd instance where just using a CSV file and creating a shapefile will work as opposed to creating or using files within the GDB.
03-19-2014
06:25 AM
- Mark as New
- Bookmark
- Subscribe
- Mute
- Subscribe to RSS Feed
- Permalink
- Report Inappropriate Content
Well closer. Now I get an Exception 001143: Background server threw an exception.
This is what I am putting into the XYtoLine box:
[ATTACH=CONFIG]32306[/ATTACH]
And the data is attached in an excel workbook (for some reason this forum won't upload .cvs files).
I feel so close - wish I could find a class that just worked with xy data.
Thanks for all your help!
Diona
This is what I am putting into the XYtoLine box:
[ATTACH=CONFIG]32306[/ATTACH]
And the data is attached in an excel workbook (for some reason this forum won't upload .cvs files).
I feel so close - wish I could find a class that just worked with xy data.
Thanks for all your help!
Diona
03-19-2014
01:51 PM
- Mark as New
- Bookmark
- Subscribe
- Mute
- Subscribe to RSS Feed
- Permalink
- Report Inappropriate Content
03-20-2014
07:36 AM
- Mark as New
- Bookmark
- Subscribe
- Mute
- Subscribe to RSS Feed
- Permalink
- Report Inappropriate Content
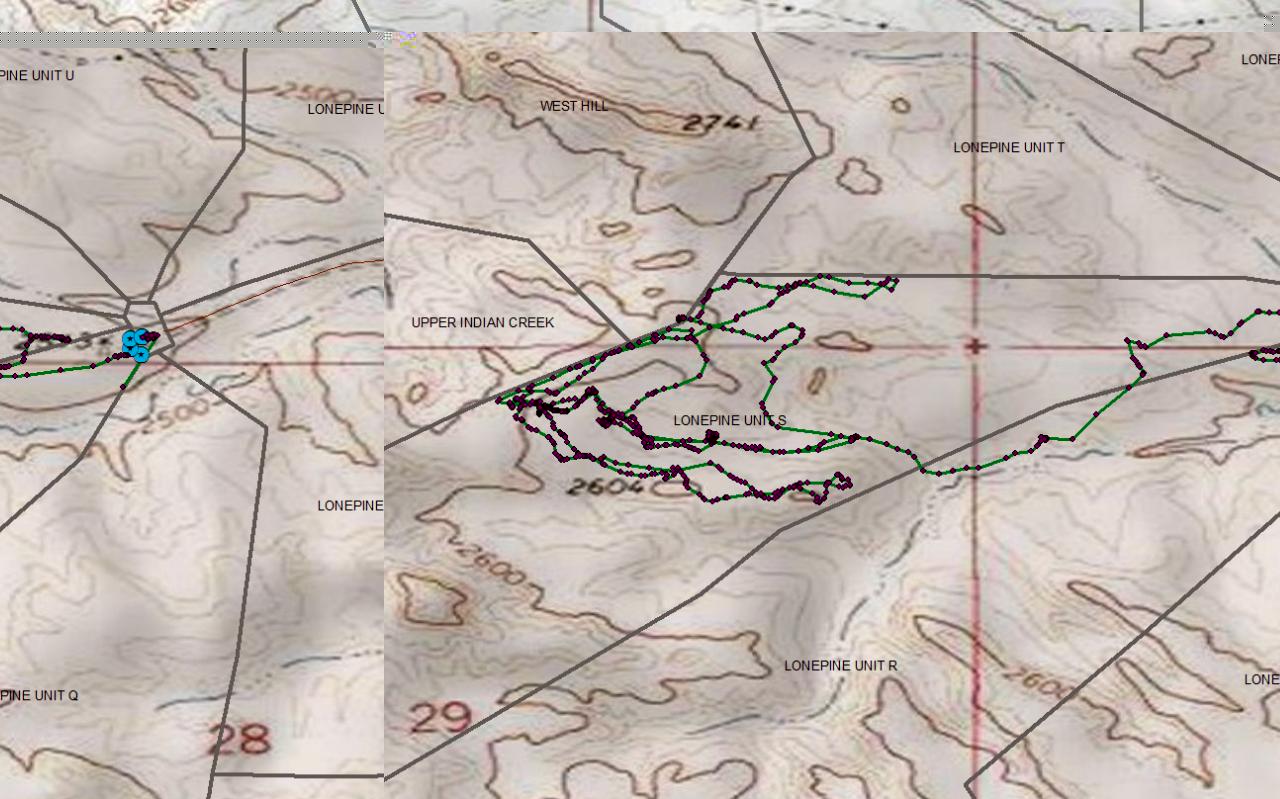
Ok, I finally got it to work. I had to export the data into a shape file, then it worked fine. One exception is the last line went way off to point 0,0 instead of ending. I just went and edited the layer and deleted it. Now on to figure out how to make this line a graduated color line. If you have any ideas, I would love to hear them!
Thanks for all your help! [ATTACH=CONFIG]32358[/ATTACH]
Thanks for all your help! [ATTACH=CONFIG]32358[/ATTACH]
03-20-2014
01:38 PM
- Mark as New
- Bookmark
- Subscribe
- Mute
- Subscribe to RSS Feed
- Permalink
- Report Inappropriate Content
If you copy your last starting coords and paste them as your ending coords your line will end at last given point. 0,0 is how ArcGIS will fill in your table for empty values.
What are you basing your graduation of line on? What value / field?
What are you basing your graduation of line on? What value / field?