Hello,
is it possible using one of the Widgets in WAB to display graphics that fall within a Start and End Date range?
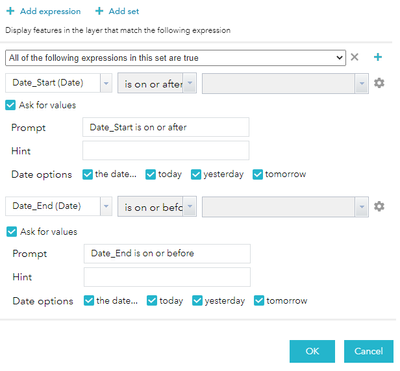
I have a linear dataset and has two Date formatted fields, one for the Start Date of works and the other the End Date.
Using the Query Widget the best I have been able to achieve is the image below but it does not fully work.
 CMcDonald_0-1668089917122.png
As you can see it's returning records that are not within the specified date range.
 CMcDonald_1-1668090107255.png
Thanks

