Turn on suggestions
Auto-suggest helps you quickly narrow down your search results by suggesting possible matches as you type.
Cancel
- Home
- :
- All Communities
- :
- Products
- :
- ArcGIS Enterprise
- :
- ArcGIS Enterprise Ideas
- :
- Custom time interval in Server statistics graph
Options
- Subscribe to RSS Feed
- Mark as New
- Mark as Read
- Bookmark
- Follow this Idea
- Printer Friendly Page
- Report Inappropriate Content
Custom time interval in Server statistics graph
Follow this Idea
331
0
08-04-2016 11:03 PM
Status:
Open
- Mark as New
- Bookmark
- Subscribe
- Mute
- Subscribe to RSS Feed
- Permalink
- Report Inappropriate Content
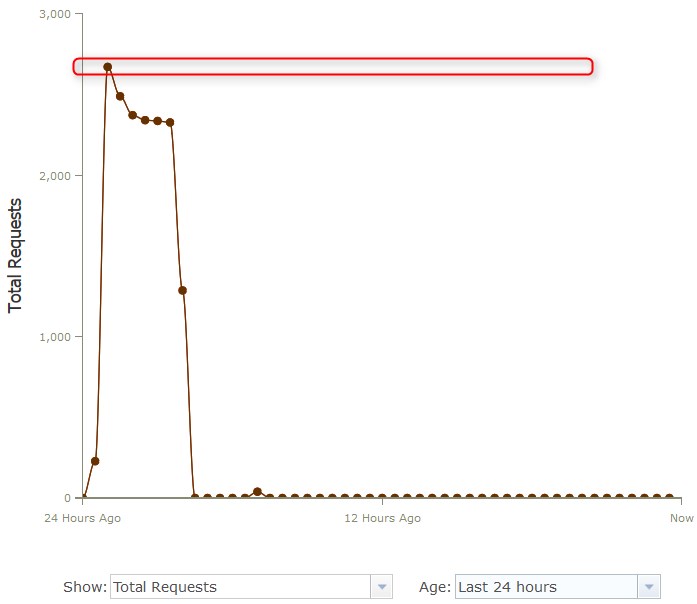
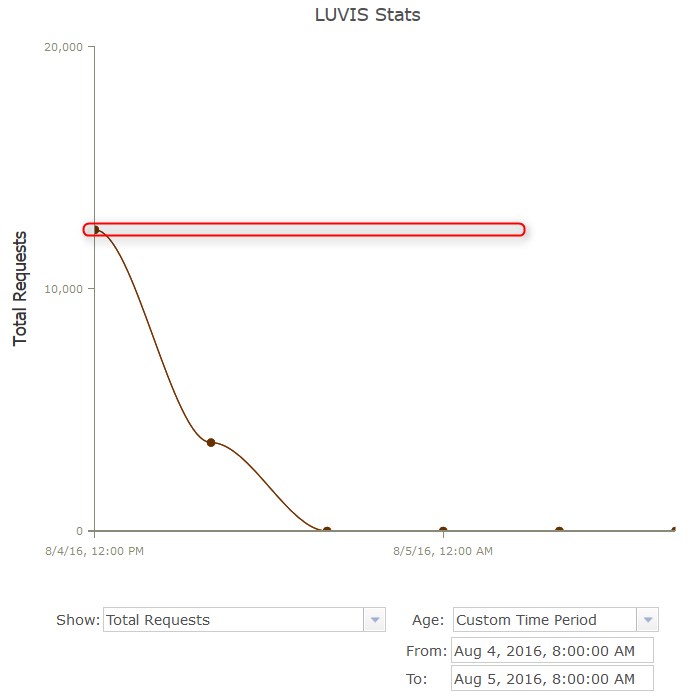
ArcGIS Server can provide some usage statistics graphs. It has ability to set report Age as predefined and custom intervals. Problem is that Server statistics time interval is calculated automatically and intervals differs thus providing misleading information.
For example Age value is specified to "Last 24 hours" shows max Total Requests = 2600

Custom Time Period for the same interval shows time graph for every 4h. Total requests > 10.000

It would be useful feature to specify custom time interval for Server statistics graph.
You must be a registered user to add a comment. If you've already registered, sign in. Otherwise, register and sign in.