- Home
- :
- All Communities
- :
- Products
- :
- ArcGIS Dashboards
- :
- ArcGIS Dashboards Questions
- :
- Stacked Serial Chart
- Subscribe to RSS Feed
- Mark Topic as New
- Mark Topic as Read
- Float this Topic for Current User
- Bookmark
- Subscribe
- Mute
- Printer Friendly Page
- Mark as New
- Bookmark
- Subscribe
- Mute
- Subscribe to RSS Feed
- Permalink
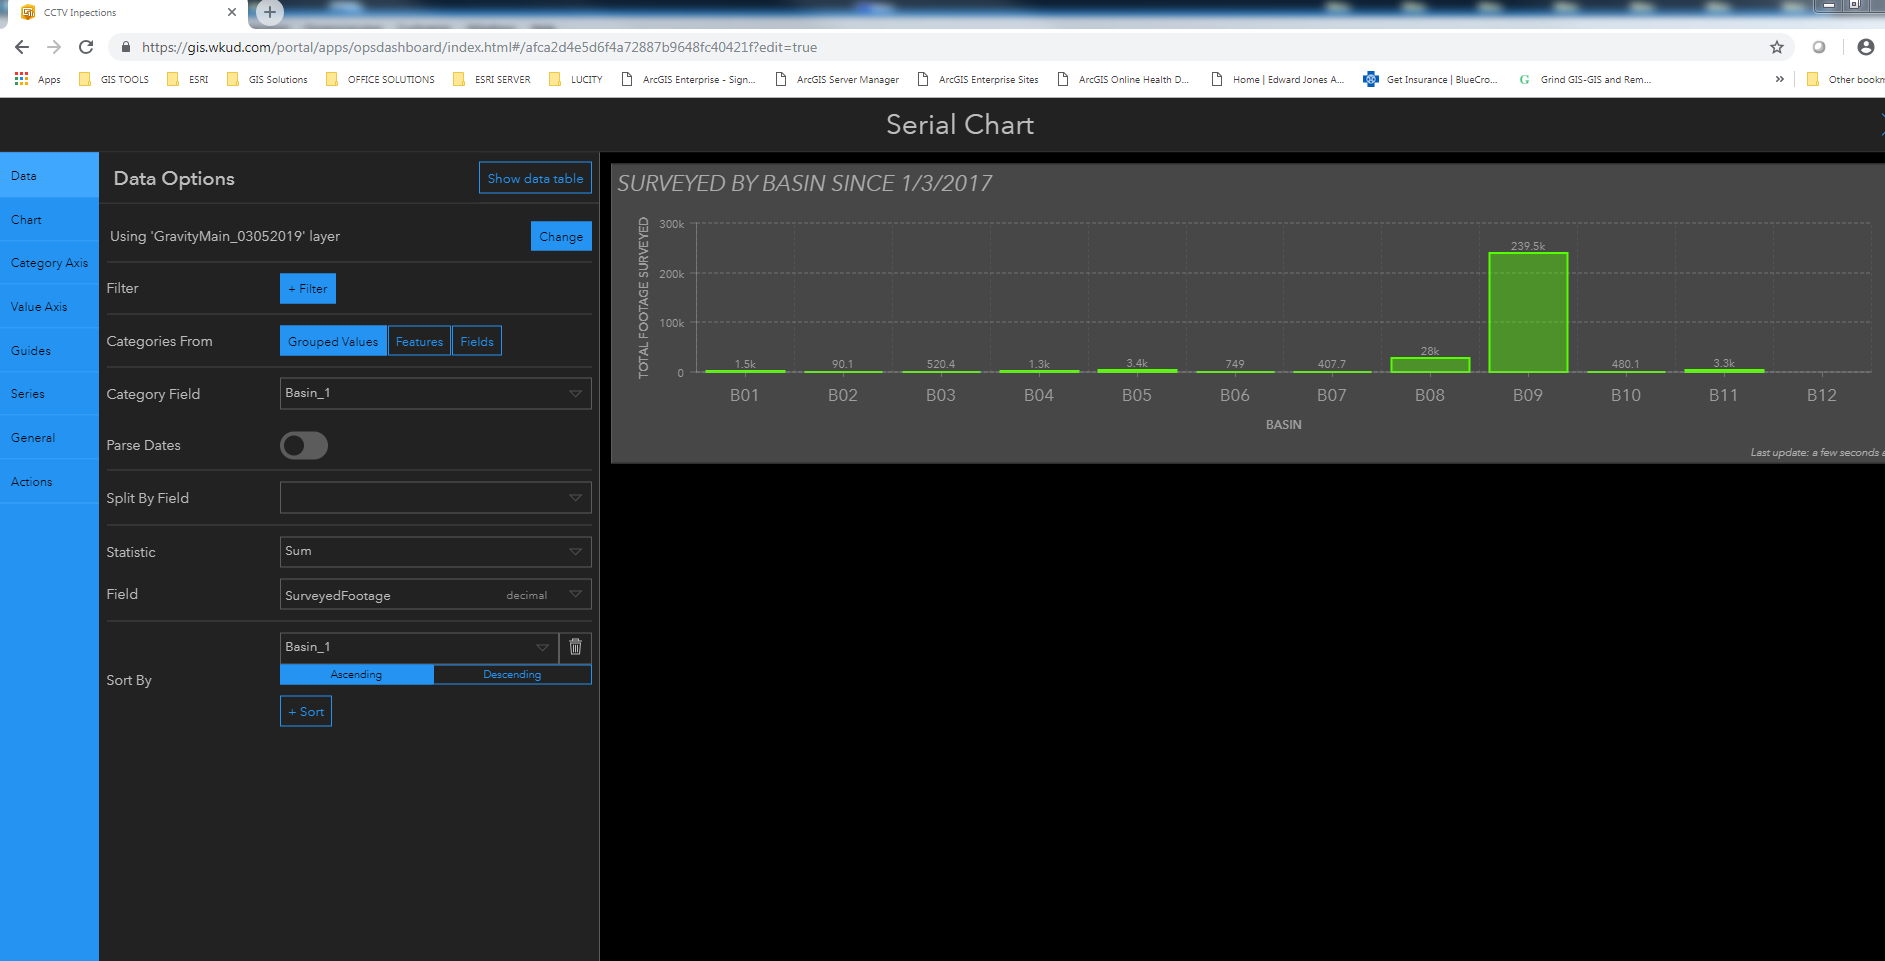
I am trying to make a bar chart to show how much gravity main we inspected. I want to show it by Basin with the surveyed footage and shape footage stacked. I can't get both to show. I assume this is something simple but,,,,,,,,,,,,,,,
I am doing this on our Portal (10.6.1), not online. Could this be a problem? I also read that map vs feature services could be a problem. Would not see it here, but who knows.
Thanks in advance for any help.
Solved! Go to Solution.
Accepted Solutions
- Mark as New
- Bookmark
- Subscribe
- Mute
- Subscribe to RSS Feed
- Permalink
Hi Larry,
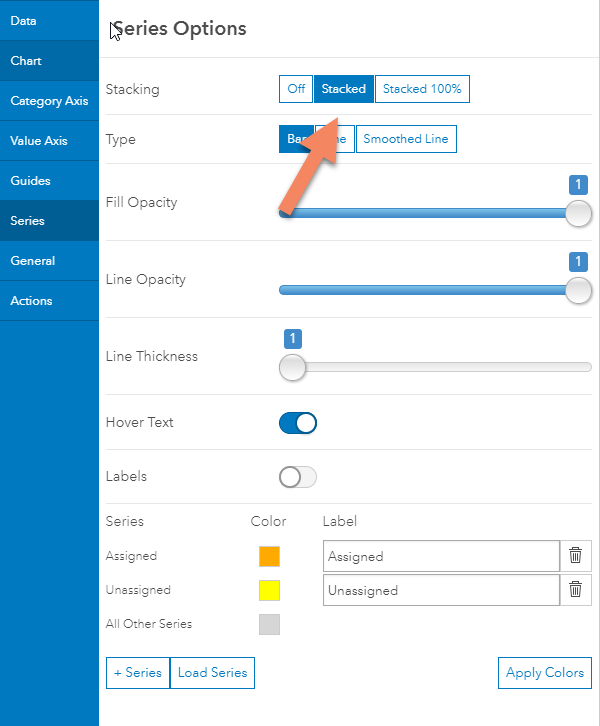
Do you have a field selected for "Split by Field" in the Data tab of the Serial Chart configuration? The "Stacked" option in the Series tab was not available for me until I split by field.
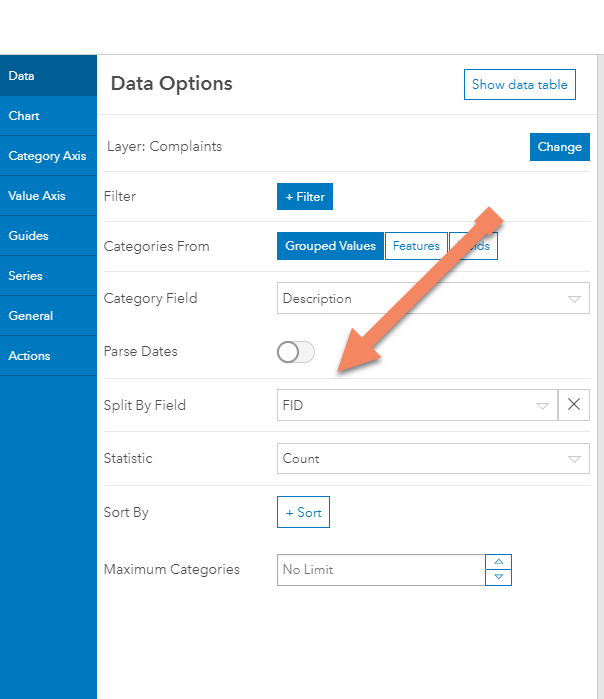
Or are they not showing even with this? Are Shape Footage and Surveyed Footage separate fields?
Best,
Claire
- Mark as New
- Bookmark
- Subscribe
- Mute
- Subscribe to RSS Feed
- Permalink
Hi Larry,
Do you have a field selected for "Split by Field" in the Data tab of the Serial Chart configuration? The "Stacked" option in the Series tab was not available for me until I split by field.
Or are they not showing even with this? Are Shape Footage and Surveyed Footage separate fields?
Best,
Claire
- Mark as New
- Bookmark
- Subscribe
- Mute
- Subscribe to RSS Feed
- Permalink
YAHTZEE!! We have a winner!!
Claire is the winner. Sorry lady the only prize you win is a very heartfelt "THANK YOU!!"
is there any documentation on this anywhere? What i have found is very vague and does not give much detail on how to build these things.
- Mark as New
- Bookmark
- Subscribe
- Mute
- Subscribe to RSS Feed
- Permalink
Hi Larry,
Sorry for the delay. I just saw the last part of your question. This is is a great list of resources from the Operations Dashboard for ArcGIS team- https://community.esri.com/community/gis/applications/operations-dashboard-for-arcgis/blog/2019/03/0....
I reference https://community.esri.com/community/gis/applications/operations-dashboard-for-arcgis/blog/2018/05/1... and https://community.esri.com/community/gis/applications/operations-dashboard-for-arcgis/blog/2018/05/1... a lot in my troubleshooting. With Operations Dashboard, it is very important to be familiar with your data (Data Source, Field Type, etc.).
Additionally, I find GeoNet to be a good resource for How To type questions if those existing resources don't answer your particular question!
- Mark as New
- Bookmark
- Subscribe
- Mute
- Subscribe to RSS Feed
- Permalink
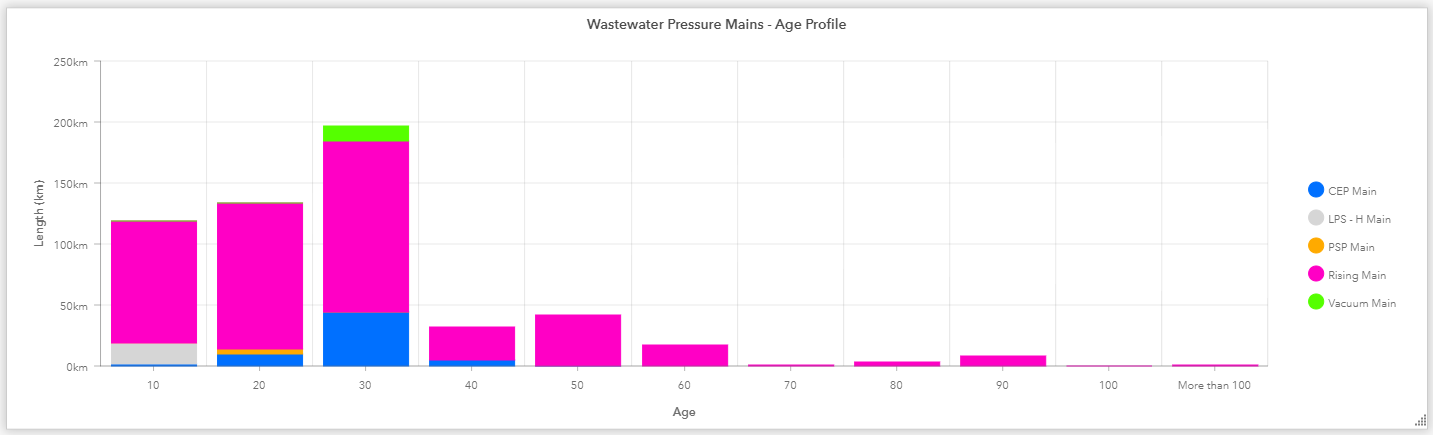
Hi all,
Any idea how to arrange the display order of a stacked bar chart? For example, I want to display Rising Main (Magenta) at the bottom and followed by other mains. I cannot find the way to arrange the display order. It seems like is based on alphabetical order.
- Mark as New
- Bookmark
- Subscribe
- Mute
- Subscribe to RSS Feed
- Permalink
This seems like a good thread to post this question. Has any one figured out how to do a stacked serial chart in Web App Builder using the dashboard theme? I feel like the dashboard theme is lacking a lot of the capabilities that Dashboard offers. On the other side Dashboard is lacking the ability to interact with data. Essentially, I want to be able to see the number of projects a project manager has by project type but also the ability to assign new projects in the same map. Pretty much looking to use a map as project management software.
Anyone have ideas on how this can be done?