- Home
- :
- All Communities
- :
- Products
- :
- ArcGIS Dashboards
- :
- ArcGIS Dashboards Questions
- :
- Serial Chart - zoom to features
- Subscribe to RSS Feed
- Mark Topic as New
- Mark Topic as Read
- Float this Topic for Current User
- Bookmark
- Subscribe
- Mute
- Printer Friendly Page
Serial Chart - zoom to features
- Mark as New
- Bookmark
- Subscribe
- Mute
- Subscribe to RSS Feed
- Permalink
I have been using the Operations Dashboard desktop software for quite some time. I'm now migrating over to the new version; however, it's a little more difficult to understand. What I am trying to do may not be possible in the online environment. I created a serial chart (bar graph) for a feature category such as "Maintenance" and the graph shows exactly what I want it to show separated out into categories but I'm trying to click on one of those categories in the chart and have it highlight/select and zoom to the data in the map. Is this a possibility? It is in the desktop version but I may not be looking in the right spot in the online version. Any help would be appreciated!
- Mark as New
- Bookmark
- Subscribe
- Mute
- Subscribe to RSS Feed
- Permalink
Derek,
For Categories from Grouped Values, how can we get the web map to behave like the chart?
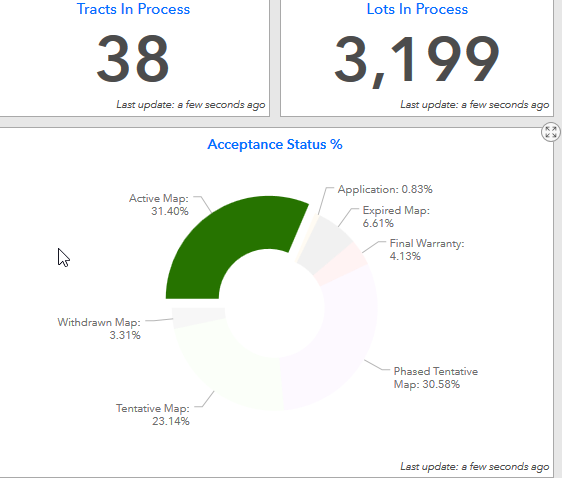
Once the user selects a chart item like Active Map the web map should be able to pan, zoom, flash and filter.
Charts as the source of actions—Operations Dashboard for ArcGIS | ArcGIS
The way you configure a chart determines the actions that can be configured.
| Configuration option | Possible action |
|---|---|
Categories from Grouped Values | Filter |
Categories from Features | Pan Zoom Flash Filter |
Categories from Fields | Not applicable (selection is not possible) |
Thank you,
-Bill
- Mark as New
- Bookmark
- Subscribe
- Mute
- Subscribe to RSS Feed
- Permalink
Hi Bill,
Map actions are currently not supported in group-by charts. Sorry.
Can you please post an enhancement request on the ArcGIS Ideas site?
Hope this helps,
- Mark as New
- Bookmark
- Subscribe
- Mute
- Subscribe to RSS Feed
- Permalink
Derek,
Thank you for clarifying the chart options.
It turns out I was using a map service in the dashboard and it did not allow me to see the filter action for the webmap.
Talking with support we re-published the mxd to include a feature service and created a new dashboard to use just that feature service. (The dashboard webmap item did not allow us to change the source of the webmap)
Then, in the new dashboard's chart filter action we could apply the filter to the webmap (feature service).
It still does not have the zoom, flash, etc. but now it is much more useful to click the chart and only see that category displayed in the webmap.
ArcGIS Ideas
- « Previous
-
- 1
- 2
- Next »
- « Previous
-
- 1
- 2
- Next »