- Home
- :
- All Communities
- :
- Products
- :
- ArcGIS Dashboards
- :
- ArcGIS Dashboards Questions
- :
- Heat map style will not update based on date selec...
- Subscribe to RSS Feed
- Mark Topic as New
- Mark Topic as Read
- Float this Topic for Current User
- Bookmark
- Subscribe
- Mute
- Printer Friendly Page
Heat map style will not update based on date selector
- Mark as New
- Bookmark
- Subscribe
- Mute
- Subscribe to RSS Feed
- Permalink
My operations dashboard on ArcGIS online has a map with records shown as both a point and a heat map, when using the date selector with associated action filters the point layer will update however the heat map does not.
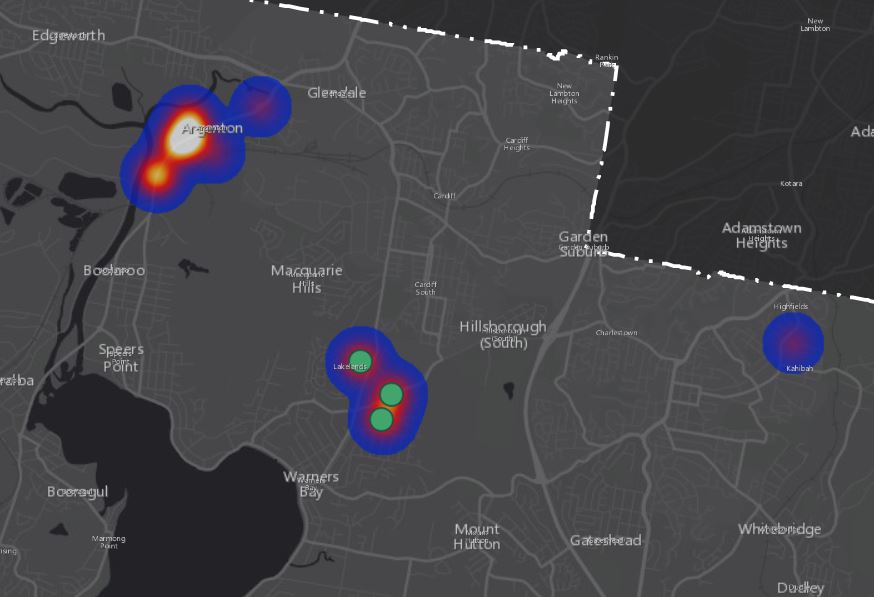
Below is a screen shot of web map from the dashboard which shows the heat map layer and the point layer, the heat map is reflecting all records in the layer but the point layer (3 green dots in centre) is filtering correctly via date selector actions. So why doesn't the heat map get regenerated based on the filtered records? The heat map is purely a style setting in the web map not a pre generated static density analysis output. All maps and content are stored on ArcGIS online with appropriate sharing rights. Zooming in/out forcing a refresh does not work.
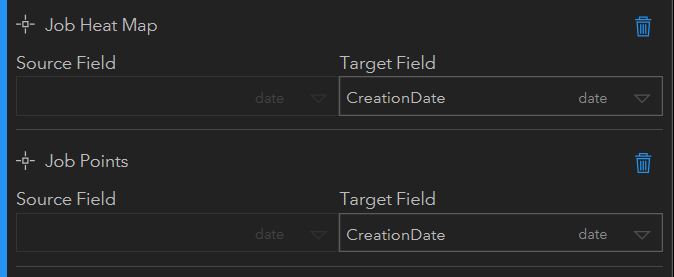
My actions specified in the date selector tool - the 'Job Points layer' updates but the 'Job Heat Map' does not.
I thought a heat map would be popular to show on a dashboard but without the ability to filter records makes it almost useless. Any ideas? I am aware that I can do a 'static' pre set filter in the web map settings but it will not match the dates chosen for the dashboard making it confusing to viewers.
Cheers,
Graeme
Solved! Go to Solution.
- Mark as New
- Bookmark
- Subscribe
- Mute
- Subscribe to RSS Feed
- Permalink
Hello everyone,
I wanted to know if this bug was fixed in ArcGIS Online? I have a webmap with a layer of points represented in Heat Map, when I add it to a Dashboard and add a Category Selector and filter the entities, it does not update the extent of the Heat Map color ramp. is there any way to do it?
- Mark as New
- Bookmark
- Subscribe
- Mute
- Subscribe to RSS Feed
- Permalink
Yes this feature is available in ArcGIS Online.
1) Clustering must not enabled and you must set the symbology attribute to "Show location only" then Heat Map will become available as a symbology type.
2) Then in dashboard you can use the filters and set the heat map layer as target.
In the screenshot below you'll notice I do have clustered points even though in step 1 "cluster must not be enabled". My work around was to create a duplicate copy of the data in the webmap. One feature has cluster points enabled as the symbology and the duplicate feature has the heat map set as the symbology from step 1. Then in the dashboard I set both map elements to be filtered by the date.

Hope this helps.
Heath.
- « Previous
- Next »
- « Previous
- Next »