Turn on suggestions
Auto-suggest helps you quickly narrow down your search results by suggesting possible matches as you type.
Cancel
- Home
- :
- All Communities
- :
- Products
- :
- ArcGIS Dashboards
- :
- ArcGIS Dashboards Questions
- :
- Generating third graph on serial chart
Options
- Subscribe to RSS Feed
- Mark Topic as New
- Mark Topic as Read
- Float this Topic for Current User
- Bookmark
- Subscribe
- Mute
- Printer Friendly Page
Generating third graph on serial chart
Subscribe
1270
1
02-11-2020 03:26 PM
02-11-2020
03:26 PM
- Mark as New
- Bookmark
- Subscribe
- Mute
- Subscribe to RSS Feed
- Permalink
Hi there,
I have generated serial chart on dashboard while looks like as below:
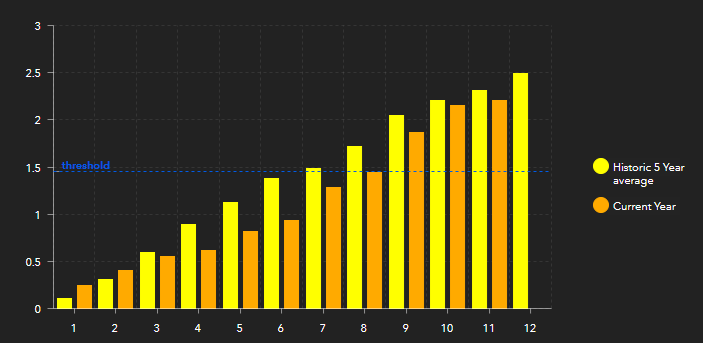
I used grouped value option to generate the grpah. X-axis shows the month and I also used split-by-field to generate two types of bar.
Now I want to add third type of graph (i.e. line) in the same chart, which would look like this:
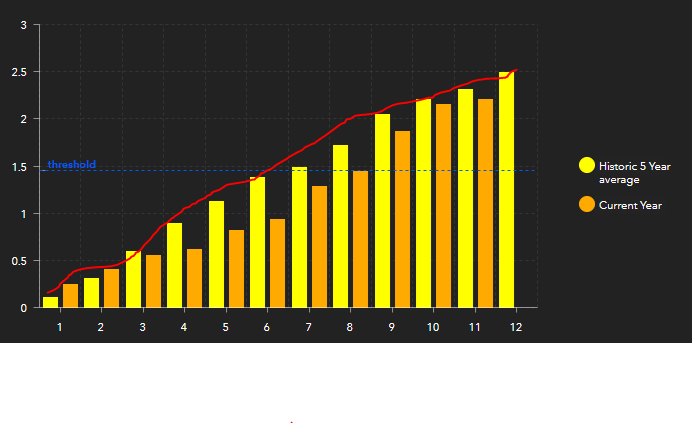
I couldnt find any option to add third graph. I tried to generate the graphs using features option on serial chart. But the problem with that approach was it didnt group the month column (category field value) and it shows all value of months on x-axis. Could anyone help me to sort out the issue?
1 Reply
02-16-2020
11:23 AM
- Mark as New
- Bookmark
- Subscribe
- Mute
- Subscribe to RSS Feed
- Permalink
Any suggestion!!! comment. Waiting for the reply