- Home
- :
- All Communities
- :
- Products
- :
- ArcGIS Dashboards
- :
- ArcGIS Dashboards Questions
- :
- Re: Gauges not showing correct reference when grou...
- Subscribe to RSS Feed
- Mark Topic as New
- Mark Topic as Read
- Float this Topic for Current User
- Bookmark
- Subscribe
- Mute
- Printer Friendly Page
Gauges not showing correct reference when grouped
- Mark as New
- Bookmark
- Subscribe
- Mute
- Subscribe to RSS Feed
- Permalink
I've been having some difficulty with gauges in my dashboard. When ungrouped, they would occasionally show incorrect visual references when the dash was first loaded, but corrected themselves after a refresh. While grouped (shift+click+drag), they consistently show incorrect references, despite displaying correctly while still in the dashboard editing interface.
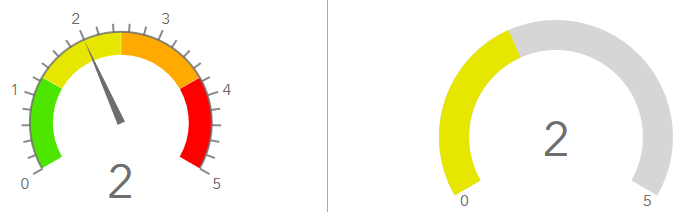
Below are two examples from the editing interface, showing how they're supposed to look. These gauges are grouped together in the dashboard. The progress-style gauge on the right has the same thresholds as the one the left (green, yellow, orange, red, every 25%).
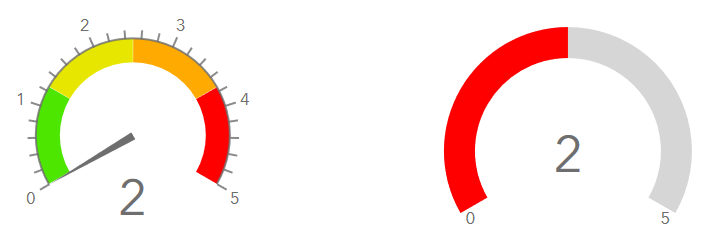
Below is how these same gauges appear in the dashboard after it's saved and accessed directly. Even though the correct number is being shown, the visual reference is incorrect. The meter-style gauge always defaults to 0, while the progress-style gauge defaults to 50% while showing an incorrect threshold color. Unlike when they were ungrouped, no amount of refreshing the dashboard will correct the data shown on these gauges.
Is this a bug? Is someone else able to reproduce this?
- Mark as New
- Bookmark
- Subscribe
- Mute
- Subscribe to RSS Feed
- Permalink
Hi Nick,
We have not seen this behavior with grouped Gauge elements. Can you please contact Esri Tech Support and open an issue with detailed repro steps so we can investigate further?
Thanks,
- Mark as New
- Bookmark
- Subscribe
- Mute
- Subscribe to RSS Feed
- Permalink
Was there a solution found for this? I experience the same issue whenever I incorporate a gauge into a dashboard. It always displays at 50% unless I am in the editing interface.
- Mark as New
- Bookmark
- Subscribe
- Mute
- Subscribe to RSS Feed
- Permalink
This issue still occurs for me in various situations. I haven't done enough testing on my own to figure out the exact set of circumstances that reproduces it (always grouped or also ungrouped? Specific issues in the data? Related tables? Just a random bug?).
I did notice, however, that if the data source has a refresh interval set, then the gauges will almost always reset to their correct displays at the first interval after the dashboard is loaded. Any manual refresh of the page itself, though, will have a decent chance of reverting the gauges back to incorrect displays again, and you'll again have to wait for the next refresh interval to fix them.
- Mark as New
- Bookmark
- Subscribe
- Mute
- Subscribe to RSS Feed
- Permalink
This makes sense--I use Firefox as my default browser. Somehow it managed to update itself this week (I'd been telling it no for months), so even the most current version is still showing this behaviour.