- Home
- :
- All Communities
- :
- Products
- :
- ArcGIS Dashboards
- :
- ArcGIS Dashboards Questions
- :
- Re: ArcGIS Dashboard Cannot access data
- Subscribe to RSS Feed
- Mark Topic as New
- Mark Topic as Read
- Float this Topic for Current User
- Bookmark
- Subscribe
- Mute
- Printer Friendly Page
ArcGIS Dashboard Cannot access data
- Mark as New
- Bookmark
- Subscribe
- Mute
- Subscribe to RSS Feed
- Permalink
I have a dashboard created that displays sample location points and their associated data. All of the data is located within a single table that is referenced to create graphs depicting both historical data and annual averages. Of the 5 sample locations, i can view historical data for all of them and yet only view the annual averages on 3 of the 5 locations. For 2 of them I get hit with a data access error. Which is weird considering its pulling all data for all 5 locations from a single table. When i go into the editor and settings for the annual averages graph, the preview graph actually shows all 5 locations data. Which is odd since when i leave the settings, it still will not display 2 of the locations' data.
So it seems that the dashboard is capable of pulling and displaying all the data within the graph preview in the editor, but is not able to show some of the data (but not all) in the actual dashboard. Any thoughts?
- Mark as New
- Bookmark
- Subscribe
- Mute
- Subscribe to RSS Feed
- Permalink
How many features are we talking about? A graph can handle a lot more than the map, as it is using aggregation methods when it makes a call to the data source. The map, on the other hand, is attempting to return all the features individually.
As an example: we have a point layer that, for the purpose of historic metrics, we have charts of. There are 750k features, and the chart handles it just fine. The map, however, can only render the first 10k before it gives the error icon.
If that's not the issue, it may be something more "interesting".
Kendall County GIS
- Mark as New
- Bookmark
- Subscribe
- Mute
- Subscribe to RSS Feed
- Permalink
The map is fine as the feature layer only has 5 sample locations (each location having a referenced table with hundreds of data points). The chart can display 3 of the locations data just fine. 2 of the locations are having access issues (one with a large amount of data and the other with a relatively small amount of referenced data). But whats more weird is that when i go into the settings of the chart (while editing the dashboard) I can preview the chart and have it show all location data. So the previewed chart has no issues accessing the data. But when i leave the settings edit and check out the actual dashboard, the chart will not load 2 of the 5 locations data. And this only applies to the data featuring the annual averages.
I have a separate chart showing ALL historical data with no statistics involved and I can view each locations data without any issues on that chart. But for whatever reason, it will not display averages for 2 of the 5 locations, even though its all run through a single table.
- Mark as New
- Bookmark
- Subscribe
- Mute
- Subscribe to RSS Feed
- Permalink
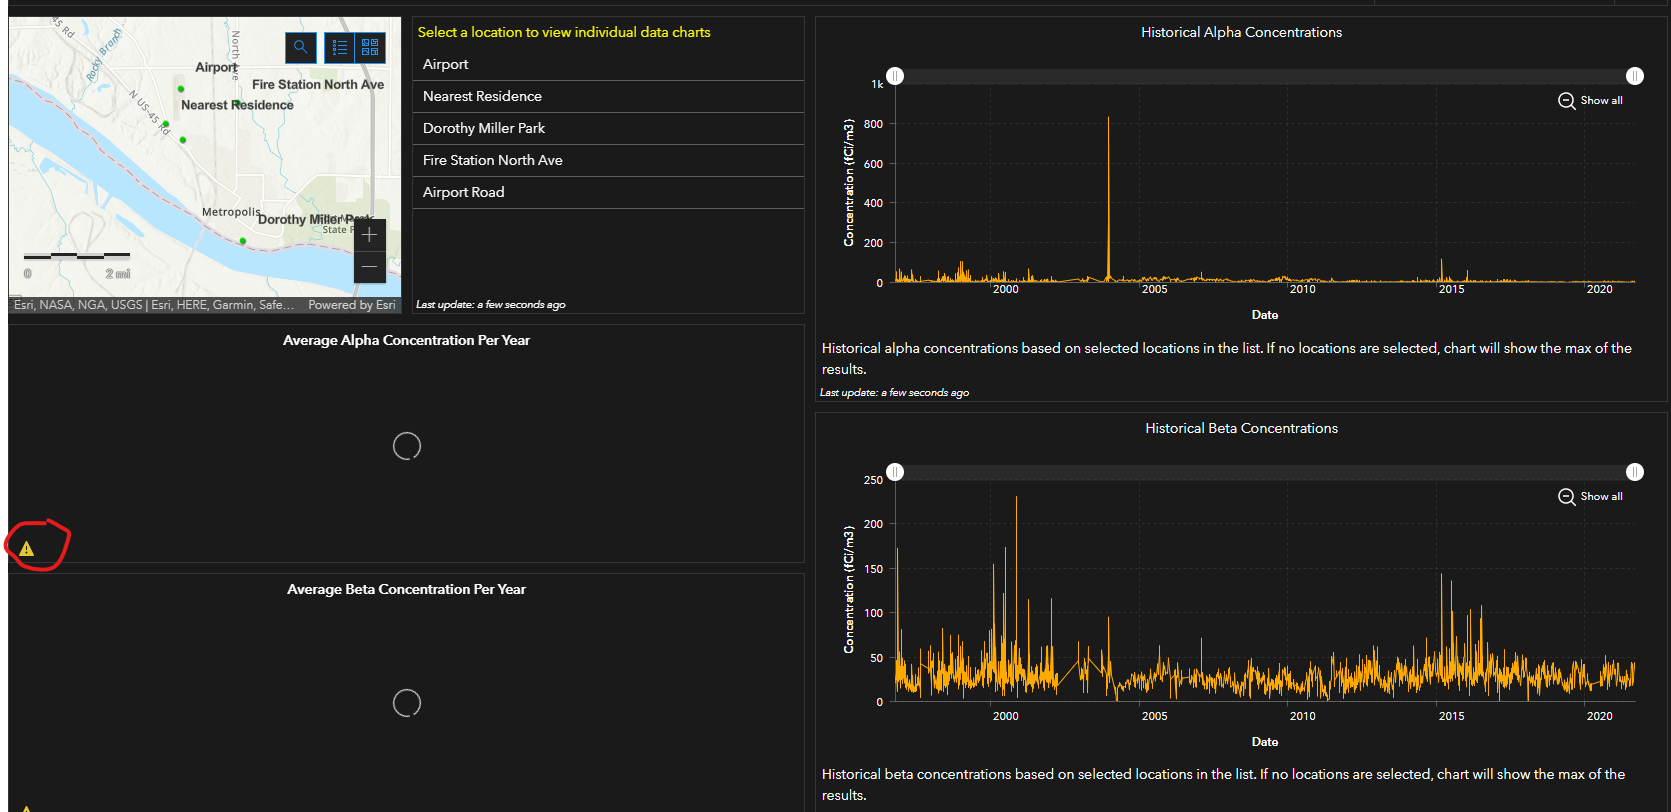
In image 1 you can see that the charts wont load at all due to data access issues.
In image 2 you can see that the average chart loads for this selected location
In image 3 you can see that the average chart will not load for this selected location, but the historical chart does.
In image 4 you can see in the settings menu that the average data IS pulled up and displayed, just not on the dashboard.
- Mark as New
- Bookmark
- Subscribe
- Mute
- Subscribe to RSS Feed
- Permalink
Hi,
I am having the same problem. All of my charts say that it cannot load the data!
The map is there. The charts are linked to the map. I try to go back in the charts to reconfigure but it does not let me choose a layer.
There were no changes to the map. I do not understand why the links are broken.