- Home
- :
- All Communities
- :
- Products
- :
- ArcGIS Business Analyst
- :
- ArcGIS Business Analyst Questions
- :
- BA Web App - Dynamic Text in Reports
- Subscribe to RSS Feed
- Mark Topic as New
- Mark Topic as Read
- Float this Topic for Current User
- Bookmark
- Subscribe
- Mute
- Printer Friendly Page
- Mark as New
- Bookmark
- Subscribe
- Mute
- Subscribe to RSS Feed
- Permalink
I have been playing around with the Business Analyst web app and had a question regarding the Report feature.
I know you can add dynamic fields for certain variables in the reports (site name, address, etc.), but is there a way to add dynamic fields for variables that would be in an attribute table?
For example: I have sites with the address, city, county, state, zip, owner name, owner ID, ect., and I would like to be to pull those fields from data in my attribute table so they auto populate in the reports I run.
Am I missing something, or is this just not supported in the web version?
Solved! Go to Solution.
Accepted Solutions
- Mark as New
- Bookmark
- Subscribe
- Mute
- Subscribe to RSS Feed
- Permalink
Hello Rachel,
Yes, you can add attributes from your web map layer or site layer in your project to infographics as dynamic attributes and display it in many different ways.
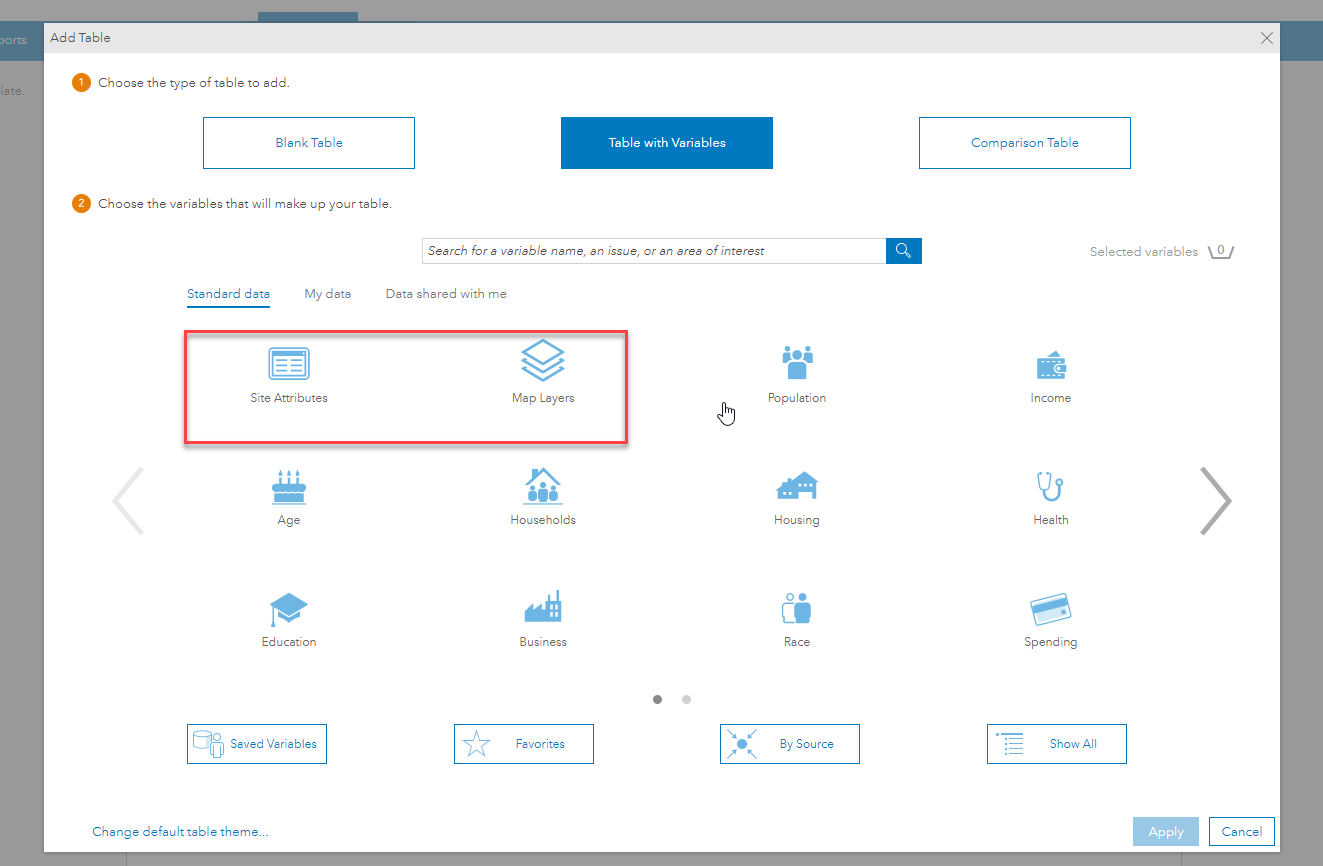
For example, I can add these attributes as tables using these data sources:

Note: Your web map layer must be visible on the map to see the "Map Layers" category.
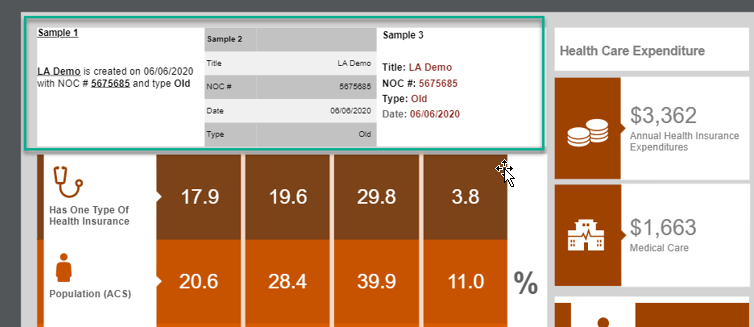
Then you can run your infographics on those features that contain the "Site Attributes" or "Map Layers" and display those attributes in these different ways:

I hope this helps.
Fasil T.
Business Analyst Team
- Mark as New
- Bookmark
- Subscribe
- Mute
- Subscribe to RSS Feed
- Permalink
Hello Rachel,
Yes, you can add attributes from your web map layer or site layer in your project to infographics as dynamic attributes and display it in many different ways.
For example, I can add these attributes as tables using these data sources:

Note: Your web map layer must be visible on the map to see the "Map Layers" category.
Then you can run your infographics on those features that contain the "Site Attributes" or "Map Layers" and display those attributes in these different ways:

I hope this helps.
Fasil T.
Business Analyst Team