Turn on suggestions
Auto-suggest helps you quickly narrow down your search results by suggesting possible matches as you type.
Cancel
- Home
- :
- All Communities
- :
- Developers
- :
- ArcGIS API Silverlight (Retired)
- :
- ArcGIS API Silverlight Questions
- :
- Can I generate several datagrids in code-behind di...
Options
- Subscribe to RSS Feed
- Mark Topic as New
- Mark Topic as Read
- Float this Topic for Current User
- Bookmark
- Subscribe
- Mute
- Printer Friendly Page
Can I generate several datagrids in code-behind displaying on one single childwindow?
Subscribe
6243
9
05-11-2011 07:10 PM
05-11-2011
07:10 PM
- Mark as New
- Bookmark
- Subscribe
- Mute
- Subscribe to RSS Feed
- Permalink
Hi guys,
I have a little complicated issue here...In my application, the identify task will perform on one or more than one layers (this depends on how many layers are set to be visible by the user). After identify task is completed, one or more datagrids will show the results in one single childwindow. Since the results are from different layers, the returning attribute fields maybe different. So it would be better that they could show in different datagrid. Just like this screenshot [ATTACH]6510[/ATTACH]
These datagrids are not fixed. The number of them relies on the number of the visible layers. In this case, there are three visible layers-ET species, Counties and CORPs District Boundaries. And in other case, there maybe only one datagrid or more than three datagrids. I am not sure whether I can generate these datagrids in code-behind, instead of in xaml which is more rigid, and let them up-down connect with each other. Really hope you can share some ideas, thoughts or sample codes 🙂 Thank you!!
9 Replies
05-12-2011
01:51 AM
- Mark as New
- Bookmark
- Subscribe
- Mute
- Subscribe to RSS Feed
- Permalink
I am not sure whether I can generate these datagrids in code-behind, instead of in xaml which is more rigid
You can do by code the same thing than by xaml.
The code to create a datagrid looks like:
var myDataGrid = new DataGrid
                    {
                        Height = 170,
                        AutoGenerateColumns = false,
                        IsReadOnly  =true,
                        HorizontalScrollBarVisibility= ScrollBarVisibility.Hidden,
                        HeadersVisibility = DataGridHeadersVisibility.Column,
                        Background = new SolidColorBrush(Colors.White),
                        RowStyle = (Style)LayoutRoot.Resources["MyCustomRow"],
                        CanUserSortColumns = true
                    };
myDataGrid.SelectionChanged += QueryDetailsDataGrid_SelectionChanged;
myDataGrid.LoadingRow += QueryDetailsDataGrid_LoadingRow;
Then you have to manage a panel with all your datagrids and add the created datagrid in this panel:
myPanel.Children.Add(myDataGrid);
05-12-2011
01:49 PM
- Mark as New
- Bookmark
- Subscribe
- Mute
- Subscribe to RSS Feed
- Permalink
Hi Dominique, thank you for your advice! I have generate the datagrids following your advice 🙂 That is really helpful. I also found some questions in the coding process which I would like to get some help. I got the results here in the attached picture [ATTACH]6536[/ATTACH]. From this picture, since there are three layers set to be visible, it returns three different datagrids which have different columns. The columns' name are correct by this line, since the key is the field alias.
But I failed to get the correct binder.path. I know I should give the field name (not the field alias) to the binder.path, however, I didn't find how to get it....
_lastIdentifyResult.ElementAt(i).Feature.Attributes.ElementAt(j).Key.ToString() -----field alias
_lastIdentifyResult.ElementAt(i).Feature.Attributes.ElementAt(j).Value.ToString() -----result value
The second question is that for some reasons the datagrids didn't show the field 'OBJECTID', but they showed the field 'Shape'. In arcmap I did set OBJECTID and Shape visible. But the weird thing is in the last thread I put (http://forums.arcgis.com/threads/29070-Can-I-change-the-layout-of-the-datagrid-in-code-behind), which is related to spatial query, the datagrid shows 'OBJECTID', but doesn't show 'Shape'....I am really curious about the reason. And I really hope that 'Shape' won't be shown just like the datagrid in spatial query. Below I attach my codes. Thank you very much 🙂
dataGridTextColumn.Header = _lastIdentifyResult.ElementAt(i).Feature.Attributes.ElementAt(j).Key.ToString();
But I failed to get the correct binder.path. I know I should give the field name (not the field alias) to the binder.path, however, I didn't find how to get it....
_lastIdentifyResult.ElementAt(i).Feature.Attributes.ElementAt(j).Key.ToString() -----field alias
_lastIdentifyResult.ElementAt(i).Feature.Attributes.ElementAt(j).Value.ToString() -----result value
The second question is that for some reasons the datagrids didn't show the field 'OBJECTID', but they showed the field 'Shape'. In arcmap I did set OBJECTID and Shape visible. But the weird thing is in the last thread I put (http://forums.arcgis.com/threads/29070-Can-I-change-the-layout-of-the-datagrid-in-code-behind), which is related to spatial query, the datagrid shows 'OBJECTID', but doesn't show 'Shape'....I am really curious about the reason. And I really hope that 'Shape' won't be shown just like the datagrid in spatial query. Below I attach my codes. Thank you very much 🙂
IdentifyPage idtask = new IdentifyPage();

private void IdentifyTask_ExecuteCompleted(object sender, IdentifyEventArgs args)
        {
            if (args.IdentifyResults.Count == 0)
            {
                MessageBox.Show("No features found at click location.");
            }

            else if (args.IdentifyResults.Count > 0)
            {
                _lastIdentifyResult = args.IdentifyResults;

                idtask.IdentifyPanel.Children.Clear();  //clear the identify results datagrids

                for (int i = 0; i < _lastIdentifyResult.Count; i++)
                {
                    TextBlock layernameTextBlc = new TextBlock();
                    layernameTextBlc.Text = _lastIdentifyResult.ElementAt(i).LayerName; //add the layer's name
                    TextBlock space = new TextBlock();
                    space.Height = 10;       //add a space between each datagrid

                        var idDataGrid = new DataGrid
                        {
                            Height = 100,
                            AutoGenerateColumns = false,
                            IsReadOnly = true,
                            HorizontalScrollBarVisibility = ScrollBarVisibility.Hidden,
                            HeadersVisibility = DataGridHeadersVisibility.Column,
                            Background = new SolidColorBrush(Colors.White),
                            RowStyle = (Style)LayoutRoot.Resources["MyCustomRow"],
                            CanUserSortColumns = true
                        };

                        List<string> fields = new List<string>();
                        idDataGrid.Columns.Clear();

                        //generate the columns
                        for (int j = 0; j < _lastIdentifyResult.ElementAt(i).Feature.Attributes.Count() - 1; j++)
                        {
                            DataGridTextColumn dataGridTextColumn = new DataGridTextColumn();
                            Binding binder = new Binding();
                            fields.Add(_lastIdentifyResult.ElementAt(i).Feature.Attributes.ElementAt(j).Value.ToString());
                            binder.Path = new PropertyPath("Attributes[" + _lastIdentifyResult.ElementAt(i).Feature.Attributes.ElementAt(j).Key + "]");

                            dataGridTextColumn.Header = _lastIdentifyResult.ElementAt(i).Feature.Attributes.ElementAt(j).Key.ToString();
                            binder.Mode = BindingMode.OneWay;
                            dataGridTextColumn.Binding = binder;
                            idDataGrid.Columns.Add(dataGridTextColumn);
                        }

                        idtask.IdentifyPanel.Children.Add(space);
                        idtask.IdentifyPanel.Children.Add(layernameTextBlc);
                        idtask.IdentifyPanel.Children.Add(idDataGrid);

                }

                idtask.ParentLayoutRoot = InfoCanvas;
                //idtask.idDataGrid.Visibility = System.Windows.Visibility.Visible;
                idtask.Show();

                //idtask.thisPass(this);  //pass current reference to rectangleselection
            }
        }
05-13-2011
01:07 AM
- Mark as New
- Bookmark
- Subscribe
- Mute
- Subscribe to RSS Feed
- Permalink
The columns' name are correct by this line, since the key is the field alias.
No, the Key is the field name (can't be the alias since there is no guarantee that an alias is unique).
Actually, the identify task doesn't return the alias at all. So we are not in the same case than in the last thread related to a spatial query.
After an identify task, it's not that easy to use the alias as header. The field name is more straightforward.
Note : I have the feeling (but I didn't test) that with your code, you will get a datagrid by feature. Not sure it's what you want? If you want a datagrid by layer, you will need additional code to group the identified features by layer.
The second question is that for some reasons the datagrids didn't show the field 'OBJECTID', but they showed the field 'Shape'.
Strange. Should show all visible fields. Try using fiddler and look at the response to the identify request : that might give a clue.
05-16-2011
12:54 PM
- Mark as New
- Bookmark
- Subscribe
- Mute
- Subscribe to RSS Feed
- Permalink
Hey Dominique, thanks very much for the tips. I got some new findings to share.
1. For identify task, the fields set to be visible in ArcMap will all show up. The fields set to be invisible will not show up in the datagrid. [ATTACH]6629[/ATTACH]
2. For spatial query task, no matter whether the OBJECTID is set to be visible or not, it will always show up. [ATTACH]6627[/ATTACH] If it is set to be visible,
3. For spatial query task, no matter whether the SHAPE is set to be visible or not, it won't show up in the datagrid.[ATTACH]6626[/ATTACH]
I am really confused that different tasks return different fields. I thought they will return, at least, all the visible fields....
Regard to the field name or the field alias, please see the first screenshot. The datagrid and the property are from the same layer. For field 'POP_1990', its field alias is Population - 1990, which shows in the datagrid...
I used "dataGridTextColumn.Header = _lastIdentifyResult.ElementAt(i).Feature.Attributes.ElementAt(j).Key.ToString()" to get the column name...so that's why I guess Key is the field alias.
But the datagrid didn't show the identify results. I used "binder.Path = new PropertyPath(_lastIdentifyResult.ElementAt(i).Feature.Attributes.ElementAt(j).Value);" to bind the results to the columns. I tied a lot of other ways but still cann't figure out how to get the results showing in the datagrid. Is there something wrong with the binder.path? Thank you!!
List<string> fields = new List<string>();
idDataGrid.Columns.Clear();

//generate the columns
for (int j = 0; j < _lastIdentifyResult.ElementAt(i).Feature.Attributes.Count(); j++)
     {
           DataGridTextColumn dataGridTextColumn = new DataGridTextColumn();
           Binding binder = new Binding();
                             fields.Add(_lastIdentifyResult.ElementAt(i).Feature.Attributes.ElementAt(j).Value.ToString());
            //binder.Path = new PropertyPath("Attributes[" + _lastIdentifyResult.ElementAt(i).Feature.Attributes.ElementAt(j).Key + "]");
                            binder.Path = new PropertyPath(_lastIdentifyResult.ElementAt(i).Feature.Attributes.ElementAt(j).Value);
                            dataGridTextColumn.Header = _lastIdentifyResult.ElementAt(i).Feature.Attributes.ElementAt(j).Key.ToString();
                            binder.Mode = BindingMode.OneWay;
                            dataGridTextColumn.Binding = binder;
                            idDataGrid.Columns.Add(dataGridTextColumn);
                        }
05-17-2011
09:21 PM
- Mark as New
- Bookmark
- Subscribe
- Mute
- Subscribe to RSS Feed
- Permalink
Hey everyone, I think I really need some help here :'(
Really appreciate any thought or idea!!
Really appreciate any thought or idea!!
05-18-2011
01:14 AM
- Mark as New
- Bookmark
- Subscribe
- Mute
- Subscribe to RSS Feed
- Permalink
Regard to the field name or the field alias, please see the first screenshot. The datagrid and the property are from the same layer. For field 'POP_1990', its field alias is Population - 1990, which shows in the datagrid...
I used "dataGridTextColumn.Header = _lastIdentifyResult.ElementAt(i).Feature.Attributes.ElementAt(j).Key.ToString()" to get the column name...so that's why I guess Key is the field alias.
My mistake:o
You are right : the Identify task returns the alias. So it's normal that you get the alias as Header and not the field name.
//binder.Path = new PropertyPath("Attributes[" + _lastIdentifyResult.ElementAt(i).Feature.Attributes.ElementAt(j).Key + "]");
binder.Path = new PropertyPath(_lastIdentifyResult.ElementAt(i).Feature.Attributes.ElementAt(j).Value);
The second line of code can't work since you are directly binding to the value instead of binding to a path containing the value. The first commented line looks good.
However this will only work if you initialize the ItemsSource of your datagrid with the list of graphics you want to see in the grid.
Even if you want only one graphic in the grid, you have to create a list with this graphic. Something like:
dataGrid.ItemsSource = new List<Graphic> { (_lastIdentifyResult.Feature};
I guess in your case, it would be better to group your graphics by layer and to display only one grid by layer. This has to be done by code:
- using the identigy result, create a list of distinct layer
- create one grid by layer
- create a list of graphics for this layer
- initialize the ItemsSource of your datagrid with that list of graphics
05-18-2011
07:00 PM
- Mark as New
- Bookmark
- Subscribe
- Mute
- Subscribe to RSS Feed
- Permalink
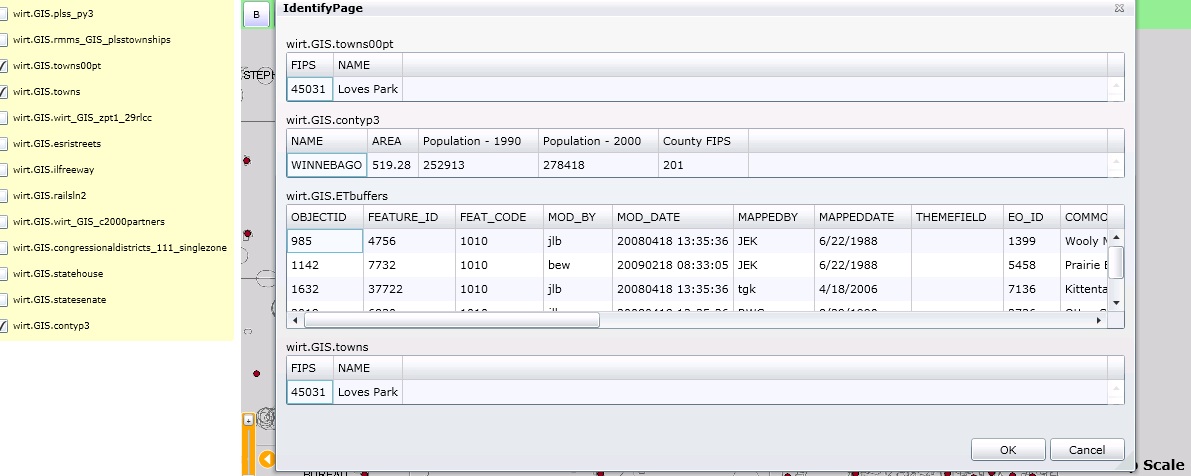
Hi Dominique, thank you!! With your advice, I am able to generate several different datagrids and show the identify results! I am really excited on this 😄 And I think your suggestion of generating datagrid by layer makes more sense since sometimes, the identify task may return more than one results from one layer. I think a little further based on your suggestion and I use a 2D graphic array to store the layerID and its graphics. Then I can assign them the graphic array or use the items inside it.
So in the end I got this result [ATTACH]6683[/ATTACH] which is pretty what I want! 🙂 But I feel a little confused here regarding to the columns. I did set AutoGenerateColumns = false in the codes, but you can see that in this screenshot, the 1,2 and 4 layers have extra columns. I don't know why this happen and I am hopping they won't appear on the identifypage. The third datagrid seems good, in which it has a horizontal scrollbar and when I scroll to the end of the right side, there is no extra column.
The second question I want to ask here is something related to overlapping. [ATTACH]6685[/ATTACH] The identifypage is beneath the layerlist (is constructed on a border). I think it may be due to floatable window's ParentLayoutRoot(idtask.ParentLayoutRoot)(I have changed the childwindow to floatable window since it won't block the interaction with parent window). I tried to change it to others but neither of them work 😞 Any suggestions or thought on how to make the datagrid on the most top?
else if (args.IdentifyResults.Count > 0)
            {
                _lastIdentifyResult = args.IdentifyResults;

                Graphic[,] identifyList = new Graphic[34,30];   //declear a 2D graphic array to store the results, row: layerid (we have 34 layers in the map service), column: graphic
                int [] gCount = new int [34];   //tract the number of graphics in each layer

                idtask.IdentifyPanel.Children.Clear();  //clear the identify results datagrid

                for (int i = 0; i < _lastIdentifyResult.Count; i++) //traversal each identify result
                {
                    int layerIndex = _lastIdentifyResult.ElementAt(i).LayerId;  //layerid of the result
                    gCount[layerIndex]++;   //the number of the graphics in this layer plus one
                    Graphic identifyGraphic = _lastIdentifyResult.ElementAt(i).Feature; //graphic of the result
                    identifyList[layerIndex, (gCount[layerIndex]-1)] = identifyGraphic; //store the layerid and the graphic to the 2D graphic array
                }

                for (int i = 0; i < 34; i++ )
                {
                    if (gCount > 0)  //if the current layer has identify results, generate datagrid
                    {
                        List<Graphic> gList = new List<Graphic>();  //declar a new graphic list to store the graphics from the same layer
                        for (int k = 0; k < gCount; k++) //add the graphics to the graphic list
                        {
                            gList.Add(identifyList[i, k]);
                        }

                        TextBlock layernameTextBlc = new TextBlock();
                        layernameTextBlc.Text = dynamicServiceLayer.Layers.ElementAt(i).Name;   //store the layer's name
                        TextBlock space = new TextBlock();  //a blank textblock used as a row space
                        space.Height = 10;


                        var idDataGrid = new DataGrid   //generate a datagrid
                        {
                            Height = (gCount == 1? 50: 125),
                            AutoGenerateColumns = false,
                            IsReadOnly = true,
                            HorizontalScrollBarVisibility = ScrollBarVisibility.Auto,
                            VerticalScrollBarVisibility = ScrollBarVisibility.Visible,
                            HeadersVisibility = DataGridHeadersVisibility.Column,
                            Background = new SolidColorBrush(Colors.White),
                            RowStyle = (Style)LayoutRoot.Resources["MyCustomRow"],
                            CanUserSortColumns = true
                        };
                        idDataGrid.Columns.Clear();

                        //initialize a new attribute used for record index
                        int rec = 0;
                        foreach (var graphic in gList)
                            graphic.Attributes["Rec"] = ++rec;

                        //generate the first column for record index
                        DataGridTextColumn dataGridTextColumnRec = new DataGridTextColumn();
                        Binding Recbinder = new Binding();
                        Recbinder.Path = new PropertyPath("Attributes[Rec]");
                        dataGridTextColumnRec.Header = "Rec";
                        Recbinder.Mode = BindingMode.OneWay;
                        dataGridTextColumnRec.Binding = Recbinder;
                        idDataGrid.Columns.Add(dataGridTextColumnRec);

                        //generate the columns
                        for (int j = 0; j < identifyList[i, 0].Attributes.Count();j++ )
                        {
                            if (identifyList[i, 0].Attributes.ElementAt(j).Key == "Shape" || identifyList[i, 0].Attributes.ElementAt(j).Key == "Shape.area" ||
                                identifyList[i, 0].Attributes.ElementAt(j).Key == "Shape.len")
                                break;
                            DataGridTextColumn dataGridTextColumn = new DataGridTextColumn();
                            Binding binder = new Binding();
                            //binder.Path = new PropertyPath("Attributes[" + _lastIdentifyResult.ElementAt(i).Feature.Attributes.ElementAt(j).Key + "]");
                            binder.Path = new PropertyPath("Attributes[" + identifyList[i, 0].Attributes.ElementAt(j).Key + "]");
                            //dataGridTextColumn.Header = _lastIdentifyResult.ElementAt(i).Feature.Attributes.ElementAt(j).Key.ToString();
                            dataGridTextColumn.Header = identifyList[i, 0].Attributes.ElementAt(j).Key.ToString();  //header is the field alias
                            binder.Mode = BindingMode.OneWay;
                            dataGridTextColumn.Binding = binder;
                            idDataGrid.Columns.Add(dataGridTextColumn);
                        }

                        idDataGrid.ItemsSource = gList; //initialize the ItemsSource of the datagrid with that list of graphics
                        //idDataGrid.ItemsSource = new List<Graphic> { identifyList[i, 0] };

                        idtask.IdentifyPanel.Children.Add(space);   //add the blank textblock
                        idtask.IdentifyPanel.Children.Add(layernameTextBlc);    //add the layer's name
                        idtask.IdentifyPanel.Children.Add(idDataGrid);  //add the datagrid
                    }
                }

                idtask.ParentLayoutRoot = InfoCanvas;
                idtask.Show();
<Border x:Name="ResourceTabBorder" Margin="5,0,5,0" Visibility="Collapsed" BorderBrush="#FFFFFFCC">
                <Grid>
                    <Grid.RowDefinitions>
                        <RowDefinition Height="30"/>
                        <RowDefinition Height="*"/>
                    </Grid.RowDefinitions>
                    <TextBlock Text="Visible Layers" Foreground="Black" FontWeight="Bold" Grid.Row="0"/>
                    <ListBox x:Name="ResourceListBox" FontSize="12" Background="#FFFFFFCC" BorderBrush="#FFFFFFCC" Grid.Row="1">
                        <ListBox.ItemTemplate>
                            <DataTemplate>
                                <CheckBox Margin="2" FontSize="9"
                                            Name="ResourceCheckBox"
                                            Content="{Binding Name}"
                                            IsChecked="{Binding DefaultVisibility}"
                                            Tag="{Binding ID}"
                                            ClickMode="Press"
                                            Click="ResourceCheckBox_Click"/>
                            </DataTemplate>
                        </ListBox.ItemTemplate>
                    </ListBox>
                </Grid>
            </Border>
05-19-2011
08:24 PM
- Mark as New
- Bookmark
- Subscribe
- Mute
- Subscribe to RSS Feed
- Permalink
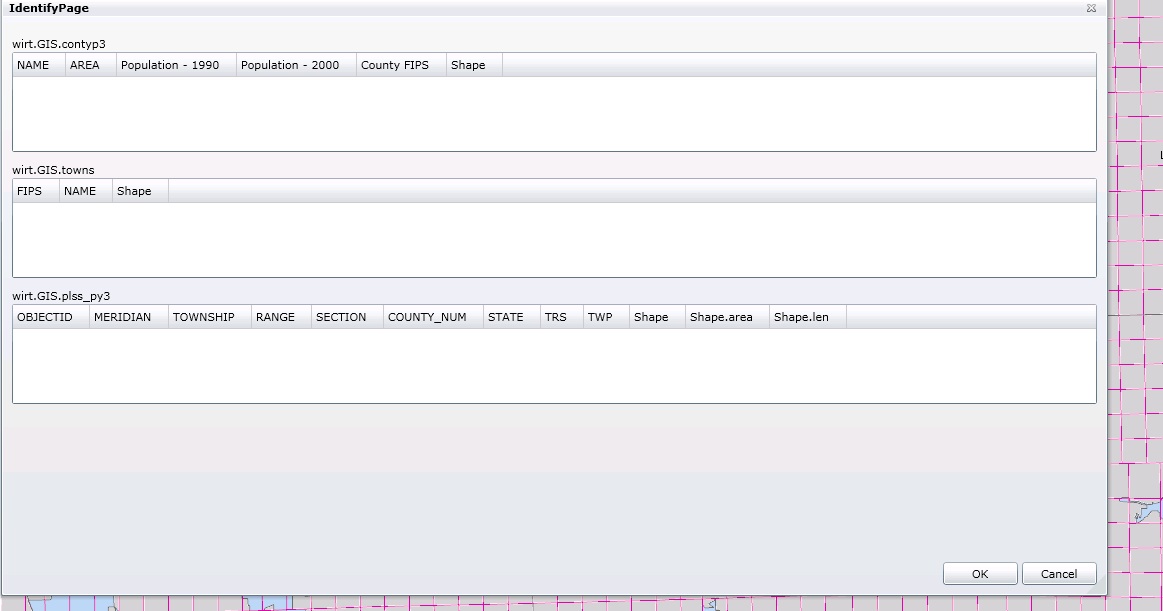
Ok, I think the first question may relate to datagrid. If I generate the datagrid in XAML, the extra columns are eliminated. [ATTACH]6719[/ATTACH]
But if I generate the datagrid in codes, I get extra columns just like the screenshot I attached in the last post.
But I still get no clue on the second question: the overlapping issue. Someone please helps me! Big thanks 🙂
<slData:DataGrid x:Name="BufferDataGrid" Grid.Row="1" Width="Auto" Height="170" AutoGenerateColumns="False" HeadersVisibility="Column" Background="White"
IsReadOnly="True" HorizontalScrollBarVisibility="Visible" VerticalScrollBarVisibility="Auto"
CanUserSortColumns="True"/>
But if I generate the datagrid in codes, I get extra columns just like the screenshot I attached in the last post.
var idDataGrid = new DataGrid   //generate a datagrid
                        {
                            Height = (gCount == 1? 70: 125), //if there is only one graphic in the layer, height = 70, otherwise, height = 125
                            AutoGenerateColumns = false,
                            IsReadOnly = true,
                            HorizontalScrollBarVisibility = ScrollBarVisibility.Auto,
                            VerticalScrollBarVisibility = ScrollBarVisibility.Visible,
                            HeadersVisibility = DataGridHeadersVisibility.Column,
                            Background = new SolidColorBrush(Colors.White),
                            CanUserSortColumns = true
                        };
But I still get no clue on the second question: the overlapping issue. Someone please helps me! Big thanks 🙂