Turn on suggestions
Auto-suggest helps you quickly narrow down your search results by suggesting possible matches as you type.
Cancel
- Home
- :
- All Communities
- :
- Developers
- :
- ArcGIS API for Flex (Retired)
- :
- ArcGIS API for Flex Questions
- :
- Column Chart - The charts's icons are on top of th...
Options
- Subscribe to RSS Feed
- Mark Topic as New
- Mark Topic as Read
- Float this Topic for Current User
- Bookmark
- Subscribe
- Mute
- Printer Friendly Page
Column Chart - The charts's icons are on top of the chart I open
Subscribe
by
Anonymous User
Not applicable
03-20-2013
12:35 PM
- Mark as New
- Bookmark
- Subscribe
- Mute
- Subscribe to RSS Feed
- Permalink
Original User: ionara_wilson
[ATTACH=CONFIG]22809[/ATTACH][ATTACH=CONFIG]22810[/ATTACH]I am using the pie chart example here
http://help.arcgis.com/en/webapi/flex/samples/index.html#//01nq00000040000000
to create an application with a column chart. However, in the ESRI example, the chart that I open gets to be on top of the others, but in mine I can see the other charts's icons overlap with my chart. How can I change the code to have the chart that I open, to be on top of the other chart's icons, as the ESRI sample? I am attaching images for comparison. Does anybody have any idea why this is happening? Thank you!!!
Here is my snippet
And the renderer:
[ATTACH=CONFIG]22809[/ATTACH][ATTACH=CONFIG]22810[/ATTACH]I am using the pie chart example here
http://help.arcgis.com/en/webapi/flex/samples/index.html#//01nq00000040000000
to create an application with a column chart. However, in the ESRI example, the chart that I open gets to be on top of the others, but in mine I can see the other charts's icons overlap with my chart. How can I change the code to have the chart that I open, to be on top of the other chart's icons, as the ESRI sample? I am attaching images for comparison. Does anybody have any idea why this is happening? Thank you!!!
Here is my snippet
protected function myMap_initializeHandler(event:MapEvent):void { // Query to get the cities under the specified state var queryTask:QueryTask = new QueryTask(); queryTask.url = "http://tfsgis-iisd01:6080/arcgis/rest/services/Economic_Impacts_Trends/TrendsServiceYearsJoined/MapServer/0"; queryTask.useAMF = false; var expr:String = ""; /* expr = "YEAR_DATA = '2009'" */ expr = "1 = '1'" var query:Query = new Query(); query.outSpatialReference = myMap.spatialReference; query.outFields = [ "*"]; query.returnGeometry = true; query.where = expr; queryTask.execute(query, new AsyncResponder(onResult, onFault)); // add the graphic on the map function onResult(featureSet:FeatureSet, token:Object = null):void { for each (var myGraphic:Graphic in featureSet.features) { myGraphicsLayer.add(myGraphic); // creating an arraycollection from the graphic attributes var object:ArrayCollection = new ArrayCollection( [ { NAME: myGraphic.attributes.NAME, YEAR: "Industry Output Totals", VALUE: myGraphic.attributes.YEAR_DATA, TOTAL07: myGraphic.attributes.DirTotal_1, TOTAL09: myGraphic.attributes.DirTotal_5 }, ]); myGraphic.attributes = object; } } function onFault(info:Object, token:Object = null):void { Alert.show(info.toString()); } }And the renderer:
<?xml version="1.0" encoding="utf-8"?> <s:VGroup xmlns:fx="http://ns.adobe.com/mxml/2009" xmlns:s="library://ns.adobe.com/flex/spark" xmlns:mx="library://ns.adobe.com/flex/mx" clipAndEnableScrolling="true" creationComplete="creationCompleteHandler()" implements="mx.core.IDataRenderer"> <!-- This is used by the QueryResultsWithChart sample. --> <fx:Style> @namespace s "library://ns.adobe.com/flex/spark"; @namespace mx "library://ns.adobe.com/flex/mx"; .InfoCloseButton { disabledSkin: Embed(source="/assets/skins.swf", symbol="Callout_closeButtonDisabledSkin"); downSkin: Embed(source="/assets/skins.swf", symbol="Callout_closeButtonDownSkin"); overSkin: Embed(source="/assets/skins.swf", symbol="Callout_closeButtonOverSkin"); upSkin: Embed(source="/assets/skins.swf", symbol="Callout_closeButtonUpSkin"); } .InfoExpandButton { disabledSkin: Embed(source="/assets/skins.swf", symbol="Callout_expandButtonDisabledSkin"); downSkin: Embed(source="/assets/skins.swf", symbol="Callout_expandButtonDownSkin"); overSkin: Embed(source="/assets/skins.swf", symbol="Callout_expandButtonOverSkin"); upSkin: Embed(source="/assets/skins.swf", symbol="Callout_expandButtonUpSkin"); } </fx:Style> <fx:Script> <![CDATA[ private var _data:Object; [Bindable] // implement IDataRenderer public function get data():Object { return _data; } public function set data(value:Object):void { _data = value; } private var _expr:String; private function creationCompleteHandler():void { parent.addEventListener(MouseEvent.ROLL_OVER, rollOverHandler); parent.addEventListener(MouseEvent.ROLL_OUT, rollOutHandler); } private function rollOverHandler(event:MouseEvent):void { if (currentState == "normal") { currentState = "titleState"; } } private function rollOutHandler(event:MouseEvent):void { if (currentState == "titleState") { currentState = "normal"; } } private function expandButton_clickHandler():void { currentState = "detailState"; } private function closeButton_clickHandler():void { currentState = "normal"; } private function effectStartHandler():void { parent.removeEventListener(MouseEvent.ROLL_OVER, rollOverHandler); } private function effectEndHandler():void { parent.addEventListener(MouseEvent.ROLL_OVER, rollOverHandler); } ]]> </fx:Script> <s:states> <s:State name="normal"/> <s:State name="titleState"/> <s:State name="detailState"/> </s:states> <s:transitions> <s:Transition fromState="*" toState="*"> <s:Resize duration="250" effectEnd="effectEndHandler()" effectStart="effectStartHandler()" target="{this}"/> </s:Transition> </s:transitions> <s:HGroup id="titleBar" width="100%" height="30%" verticalAlign="middle"> <mx:Image id="pieChartImage" width="5" height="5" source="@Embed(source='/assets/ColumnChart2.png')"/> <s:Label id="titleLabel" fontSize="10" fontWeight="bold" includeIn="titleState,detailState" text="{data.getItemAt(0).NAME}"/> <mx:Button id="expandButton" width="18" height="18" click="expandButton_clickHandler()" includeIn="titleState" styleName="InfoExpandButton"/> <mx:Spacer width="100%" includeIn="detailState"/> <mx:Button id="closeButton" width="18" height="18" click="closeButton_clickHandler()" includeIn="detailState" styleName="InfoCloseButton"/> </s:HGroup> <mx:ColumnChart id="columnchart" showDataTips="true" selectionMode="multiple" width="150" height="150" dataProvider="{data}" includeIn="detailState" > <mx:horizontalAxis > <mx:CategoryAxis id="categoryaxis" dataProvider="{data}" categoryField="NAME" /> </mx:horizontalAxis> <mx:series> <mx:ColumnSeries interactive="true" labelField="NAME" id="column1" displayName="2007" xField = "NAME" yField="TOTAL07" dataProvider="{data}"/> <mx:ColumnSeries interactive="true" labelField="NAME" id="column2" displayName="2009" xField = "NAME" yField="TOTAL09" dataProvider="{data}"/> </mx:series> </mx:ColumnChart> <mx:Legend dataProvider="{data}" scaleX="0.3" scaleY="0.3"/> </s:VGroup>Solved! Go to Solution.
1 Solution
Accepted Solutions
by
Anonymous User
Not applicable
03-21-2013
09:42 AM
- Mark as New
- Bookmark
- Subscribe
- Mute
- Subscribe to RSS Feed
- Permalink
Original User: sumof2cubes
[ATTACH=CONFIG]22844[/ATTACH]
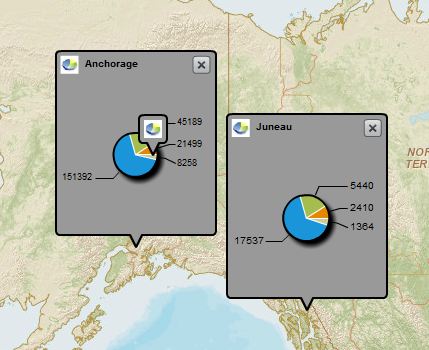
The same thing happens to the ESRI example until you mouseover one of the infoRenderers. Does yours bring the mouseover infoRenderer to the front? This could help lead to a resolution.
[ATTACH=CONFIG]22844[/ATTACH]
The same thing happens to the ESRI example until you mouseover one of the infoRenderers. Does yours bring the mouseover infoRenderer to the front? This could help lead to a resolution.
3 Replies
03-21-2013
05:55 AM
- Mark as New
- Bookmark
- Subscribe
- Mute
- Subscribe to RSS Feed
- Permalink
I tried everything and I suspect that there is something wrong with my feature layer. Can you guys please take a look and let me know what I should do different in my layer? I am not including all the fields because it would be tool long but here is the layers for comparison
Thanks!
My layer
http://tfsgis-iisd01:6080/arcgis/rest/services/Economic_Impacts_Trends/TrendsServiceYearsJoined/MapS...
And here is the ESRI layer
http://sampleserver1.arcgisonline.com/ArcGIS/rest/services/Specialty/ESRI_StatesCitiesRivers_USA/Map...
Thanks!
My layer
http://tfsgis-iisd01:6080/arcgis/rest/services/Economic_Impacts_Trends/TrendsServiceYearsJoined/MapS...
Layer: EconomicImpactsTrends.TRENDSEDITOR.Ecoimpacts_trends_07_09_Joined (ID: 0)
Name: EconomicImpactsTrends.TRENDSEDITOR.Ecoimpacts_trends_07_09_Joined

Display Field: NAME

Type: Feature Layer

Geometry Type: esriGeometryPoint

Description:

Definition Expression:

Copyright Text:

Default Visibility: true

MaxRecordCount: 1000

Supported Query Formats: JSON, AMF

Min Scale: 0

Max Scale: 0

Supports Advanced Queries: true

Supports Statistics: true

Has Labels: false

Can Modify Layer: false

Can Scale Symbols: false

Extent:

    XMin: -1.06862384587E7
    YMin: 3485785.890299998
    XMax: -1.04354477563E7
    YMax: 3978750.918700002
    Spatial Reference: 102100  (3857)


Drawing Info:

    Renderer:
        Simple Renderer:
        Symbol:
            Style: esriSMSCircle
            Color: [0, 122, 140, 255]
            Size: 4.0
            Angle: 0.0
            XOffset: 0
            YOffset: 0
            Outline:
                [0, 0, 0, 255] Width: 1 Label:
        Description: Transparency: 0
    Labeling Info:


HasZ: false

HasM: false

Has Attachments: false

HTML Popup Type: esriServerHTMLPopupTypeAsHTMLText

Type ID Field: null

Fields:

    OBJECTID_12 ( type: esriFieldTypeOID , alias: OBJECTID_12 )
    OBJECTID_1 ( type: esriFieldTypeDouble , alias: OBJECTID_1 )
    NAME ( type: esriFieldTypeString , alias: NAME , length: 32 )
    CNTY_FIPS ( type: esriFieldTypeString , alias: CNTY_FIPS , length: 3 )
    FIPS ( type: esriFieldTypeString , alias: FIPS , length: 5 )
    OBJECTID ( type: esriFieldTypeDouble , alias: OBJECTID )
    NAME_1 ( type: esriFieldTypeString , alias: NAME_1 , length: 15 )
    ForDirIndO ( type: esriFieldTypeDouble , alias: ForDirIndO )
    ForDirEmp ( type: esriFieldTypeDouble , alias: ForDirEmp )


Supported Operations:   Query   Generate Renderer   Return Updates
And here is the ESRI layer
http://sampleserver1.arcgisonline.com/ArcGIS/rest/services/Specialty/ESRI_StatesCitiesRivers_USA/Map...
Layer: Cities (ID: 0)
Display Field: CITY_NAME

Type: Feature Layer

Geometry Type: esriGeometryPoint

Description: This service presents census information for U.S. cities and states including total population, racial counts, and more. It also includes rivers.

Definition Expression:

Copyright Text: (c) ESRI and its data partners

Min. Scale: 0

Max. Scale: 0

Default Visibility: True

Extent:

    XMin: -158.064605712891
    YMin: 19.6961498260498
    XMax: -67.986768734036
    YMax: 64.8691042579708
    Spatial Reference: 4326

Has Attachments: False

HTML Popup Type: esriServerHTMLPopupTypeNone

Drawing Info:

    Renderer:
        Simple Renderer:
        Symbol:
            Simple Marker Symbol:
            Style: esriSMSCircle, Color: [156, 173, 0, 255], Size: 4, Angle: 0, XOffset: 0, YOffset: 0
            Outline
                Color: [0, 0, 0, 255], Width: 1Label:
        Description:
    Transparency: 0
    Labeling Info: N/A

Fields:

    FID (Type: esriFieldTypeOID, Alias: FID)
    Shape (Type: esriFieldTypeGeometry, Alias: Shape)
    CITY_FIPS (Type: esriFieldTypeString, Alias: CITY_FIPS, Length: 5 )
    CITY_NAME (Type: esriFieldTypeString, Alias: CITY_NAME, Length: 40 )
    STATE_FIPS (Type: esriFieldTypeString, Alias: STATE_FIPS, Length: 2 )
    STATE_NAME (Type: esriFieldTypeString, Alias: STATE_NAME, Length: 25 )
    STATE_CITY (Type: esriFieldTypeString, Alias: STATE_CITY, Length: 7 )
    TYPE (Type: esriFieldTypeString, Alias: TYPE, Length: 25 )
    CAPITAL (Type: esriFieldTypeString, Alias: CAPITAL, Length: 1 )
    ELEVATION (Type: esriFieldTypeSmallInteger, Alias: ELEVATION)
    POP1990 (Type: esriFieldTypeInteger, Alias: POP1990)
    HOUSEHOLDS (Type: esriFieldTypeInteger, Alias: HOUSEHOLDS)
    MALES (Type: esriFieldTypeInteger, Alias: MALES)
    FEMALES (Type: esriFieldTypeInteger, Alias: FEMALES)
    WHITE (Type: esriFieldTypeInteger, Alias: WHITE)
    BLACK (Type: esriFieldTypeInteger, Alias: BLACK)
    AMERI_ES (Type: esriFieldTypeInteger, Alias: AMERI_ES)
    ASIAN_PI (Type: esriFieldTypeInteger, Alias: ASIAN_PI)


Type ID Field: N/A

Supported Interfaces:   REST

Supported Operations:   Query
by
Anonymous User
Not applicable
03-21-2013
09:42 AM
- Mark as New
- Bookmark
- Subscribe
- Mute
- Subscribe to RSS Feed
- Permalink
03-21-2013
11:56 AM
- Mark as New
- Bookmark
- Subscribe
- Mute
- Subscribe to RSS Feed
- Permalink
Thank you so much Justin. Your observation made me compare more the code I was running with the code in the ESRI site, and I realized that the SDK should be 4.5.1A and the library should be agslib 2.5. I was using SDK 4.6 and Esri library. 3.0.
I think the issue of seeing the symbol overlapped with the ESRI sample only happens if you open the icon for Fairbanks, then open the icon for Anchorage, then close the icon for Fairbanks, right? It just appears for a few seconds, then it disappears when you mouse over anywhere else. I think that part is ok, my problem was that the icon below was just overlapping on top of the infowindow I opened, but it looks like the ESRI sample now! Thank you so much for helping me!!!
I think the issue of seeing the symbol overlapped with the ESRI sample only happens if you open the icon for Fairbanks, then open the icon for Anchorage, then close the icon for Fairbanks, right? It just appears for a few seconds, then it disappears when you mouse over anywhere else. I think that part is ok, my problem was that the icon below was just overlapping on top of the infowindow I opened, but it looks like the ESRI sample now! Thank you so much for helping me!!!