- Home
- :
- All Communities
- :
- Products
- :
- 3D
- :
- 3D Questions
- :
- vertical exaggeration
- Subscribe to RSS Feed
- Mark Topic as New
- Mark Topic as Read
- Float this Topic for Current User
- Bookmark
- Subscribe
- Mute
- Printer Friendly Page
vertical exaggeration
- Mark as New
- Bookmark
- Subscribe
- Mute
- Subscribe to RSS Feed
- Permalink
Hi,
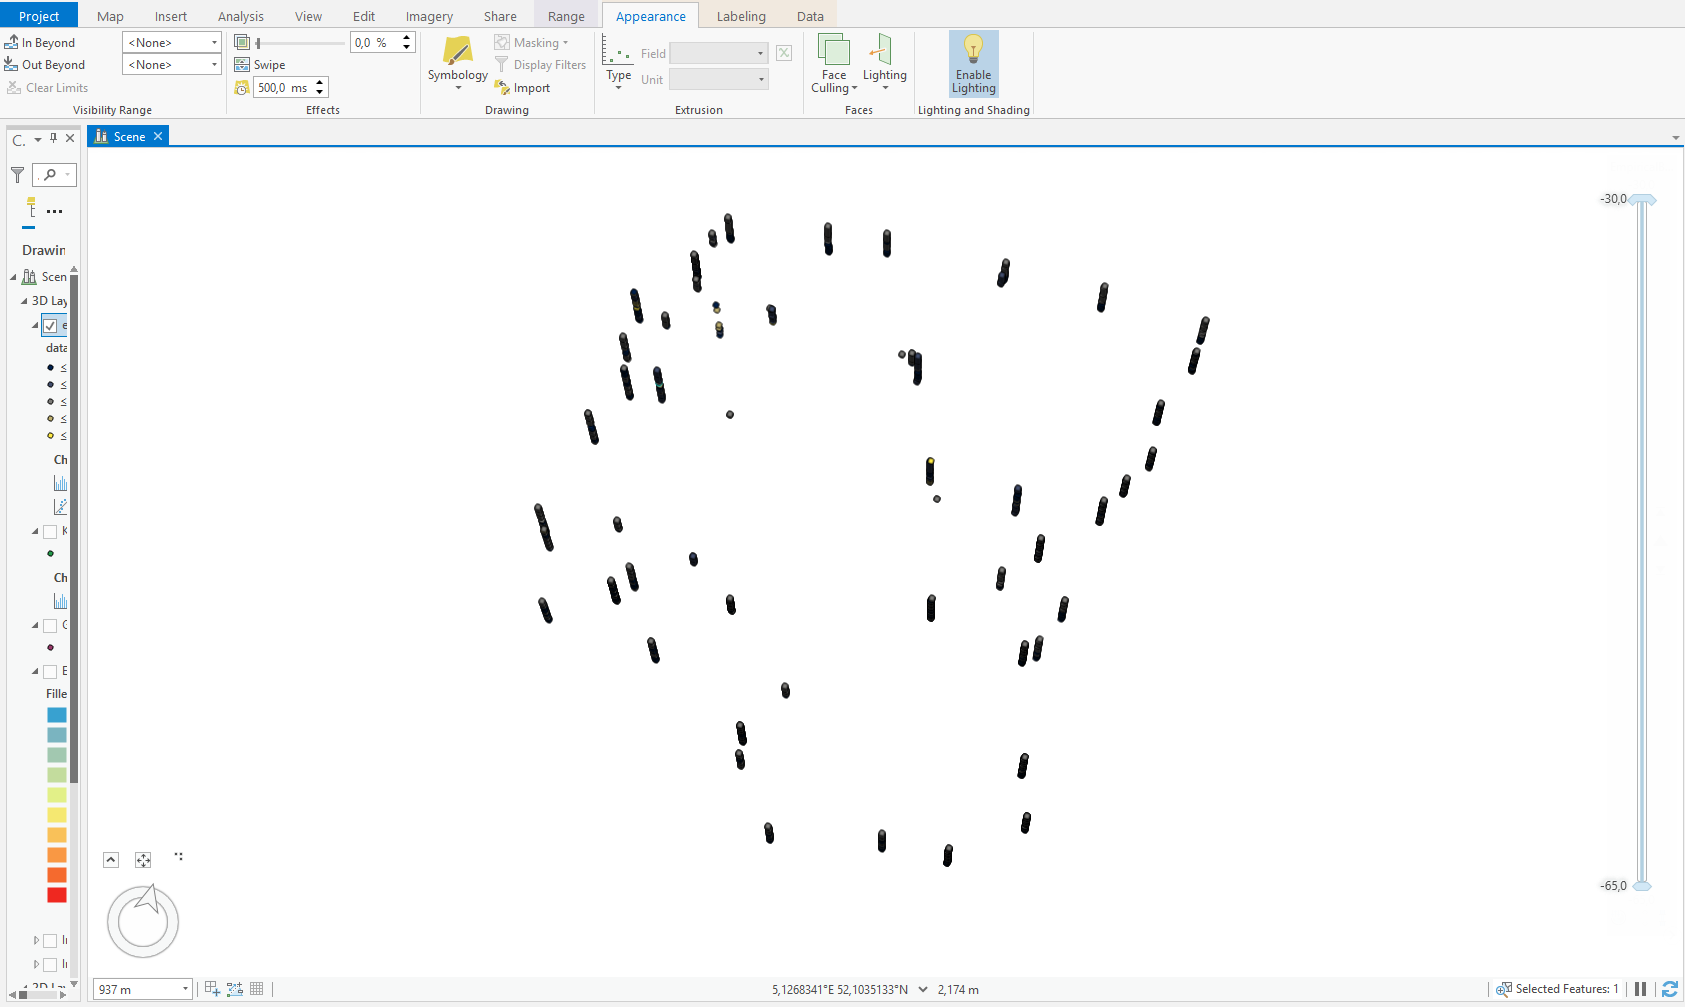
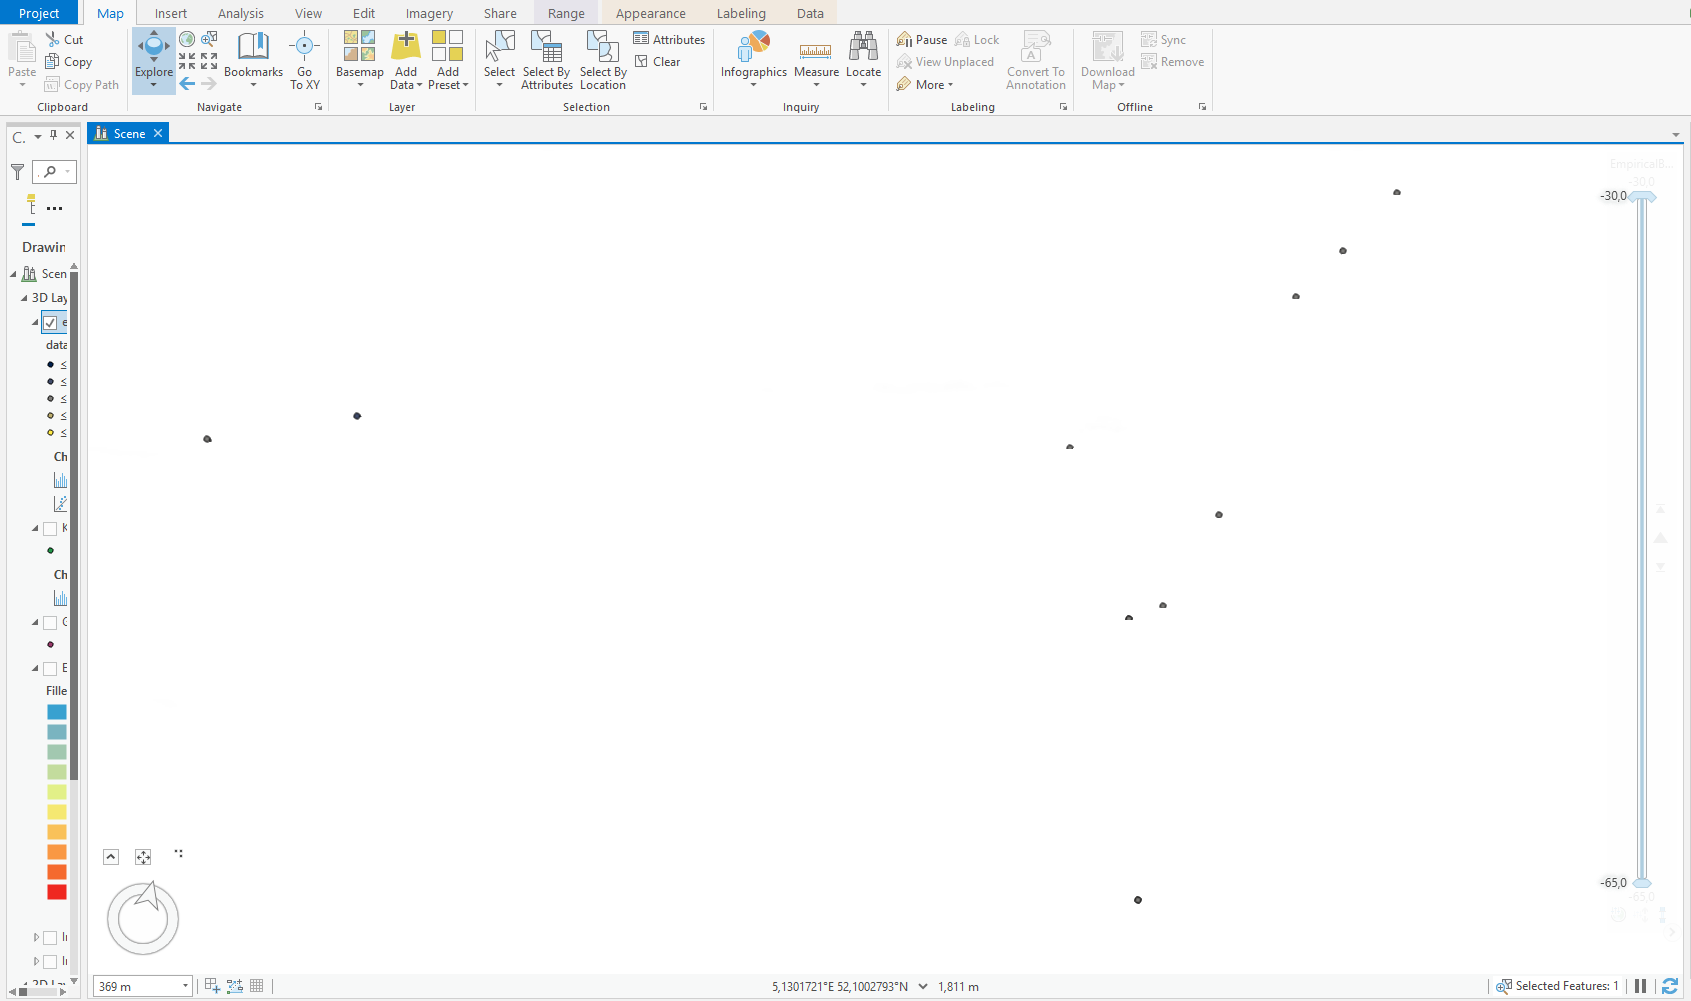
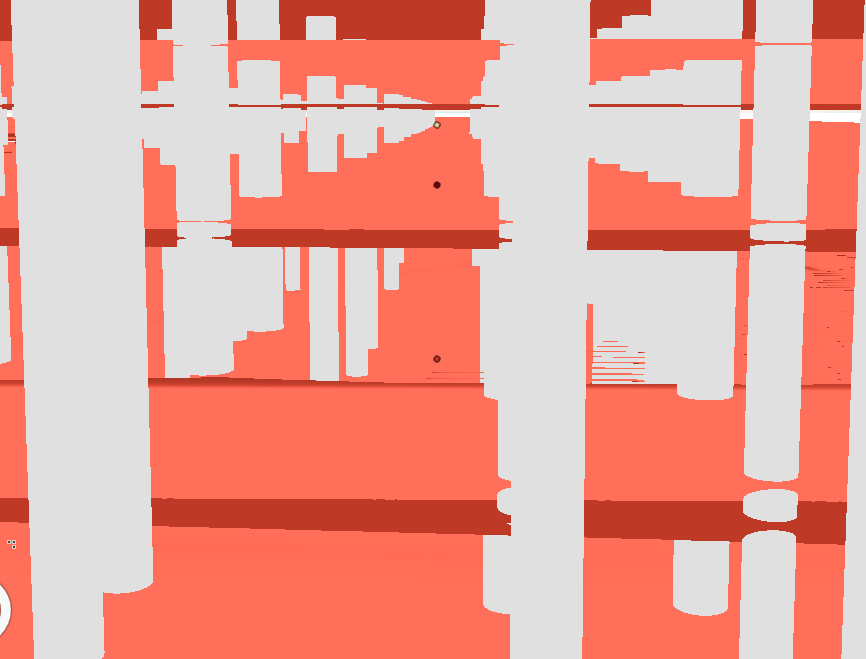
I have a set of 3d point data (hydraulic conductivity according to performed drillings). I want to use this dataset for geostatistical interpolation. To be able to start with an investigation of my dataset I coloured the values with a gradient. I see my data as below. The datapoints are too close together in the vertical direction to be able to study them. When I zoom in by scrolling the mouse, the dots disappear from view (see bottom picture). With the sliding bar on the right I can't seem to do anything for the view.
I thought I use a vertical exaggeration, but I don't see how (there is no option for it under the appearance tab).
Does anyone have an idea how to solve this?
Thanks, Suzanne
- Mark as New
- Bookmark
- Subscribe
- Mute
- Subscribe to RSS Feed
- Permalink
perhaps in a scene
Extrude features to 3D symbology—ArcGIS Pro | Documentation
... sort of retired...
- Mark as New
- Bookmark
- Subscribe
- Mute
- Subscribe to RSS Feed
- Permalink
Hi Dan,
Thank you for the suggestion. I uploaded the data in Scene and I don't see any difference in visualisation options.
By the way I am using ArcGIS pro 2.6.
- Mark as New
- Bookmark
- Subscribe
- Mute
- Subscribe to RSS Feed
- Permalink
So that is after extruding the features as in the link?
... sort of retired...
- Mark as New
- Bookmark
- Subscribe
- Mute
- Subscribe to RSS Feed
- Permalink
Hi Dan,
silly I didn't see you posted a link there..
Meanwhile I managed with Philip's remark, simply by unchecking the ground (world elevation) box under the contents tab.
Thanks again for our help!
Suzanne
- Mark as New
- Bookmark
- Subscribe
- Mute
- Subscribe to RSS Feed
- Permalink
Hi Suzanne- I love these use cases, and I have an example like this right in front of me.
I think what you may have happening here is simply a rendering issue with immediate subsurface 2D symbols. Even though you've removed the basemap in your scene view, the 2D point symbols are conflicting with the elevation surface and irregularly rendering. You can check this by navigating under the surface-
- In the Contents pane, choose the Ground elevation surface.
- On the Appearance tab, check the Navigate Underground checkbox.
Even though it is possible to vertically exaggerate these readings, I would advise against it before producing an analysis product with 3DEBK as it's expect real-world inputs and the results will differ with exaggeration. You're also able to set a vertical exaggeration for Voxels.
I'll tell you how to do it anyway 
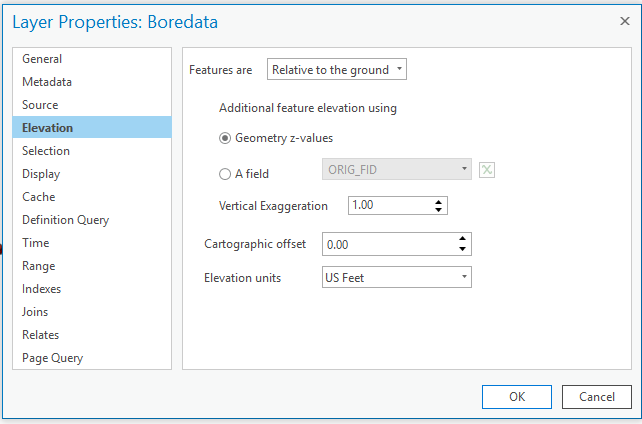
Exaggeration in Pro is a per-layer setting. Under Layer Properties->Elevation, you'll find a vertical exaggeration parameter.
If you intend to publish or share this layer outside of this Pro Project,you'll need to us the GP tool "Layer 3D to Feature Class" to "burn" the geometry exaggeration changes into the feature.
So- cool about the workflow afterwards. Definitely check out the 3D Empirical Bayesian Kriging tool, which can take numeric values and interpolate data. There's a recent tool with Pro 2.6 where you're able to export 3DEBK results to netCDF to be read as Voxels in Pro 2.6 Advanced.
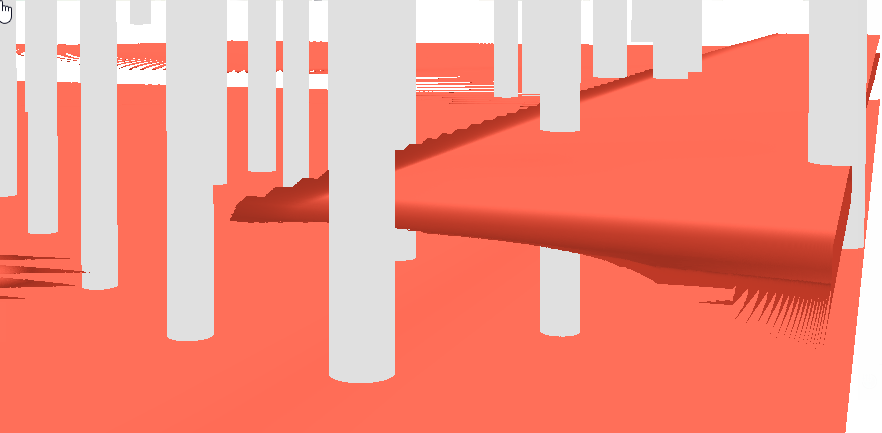
I have a similar example here with soil density borehole values under a large piece of infrastructure: 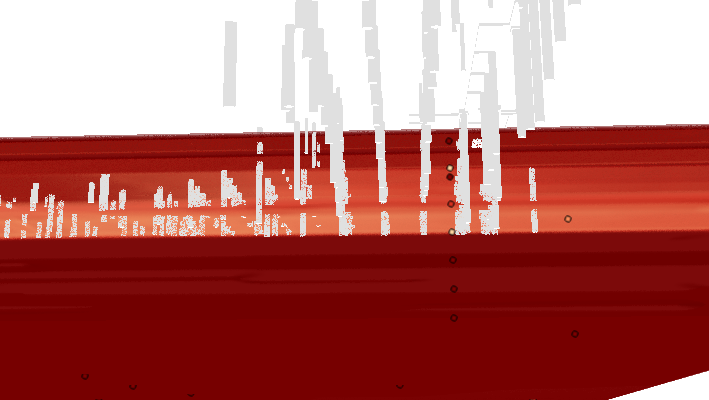
Really interested in your results!
Phil
- Mark as New
- Bookmark
- Subscribe
- Mute
- Subscribe to RSS Feed
- Permalink
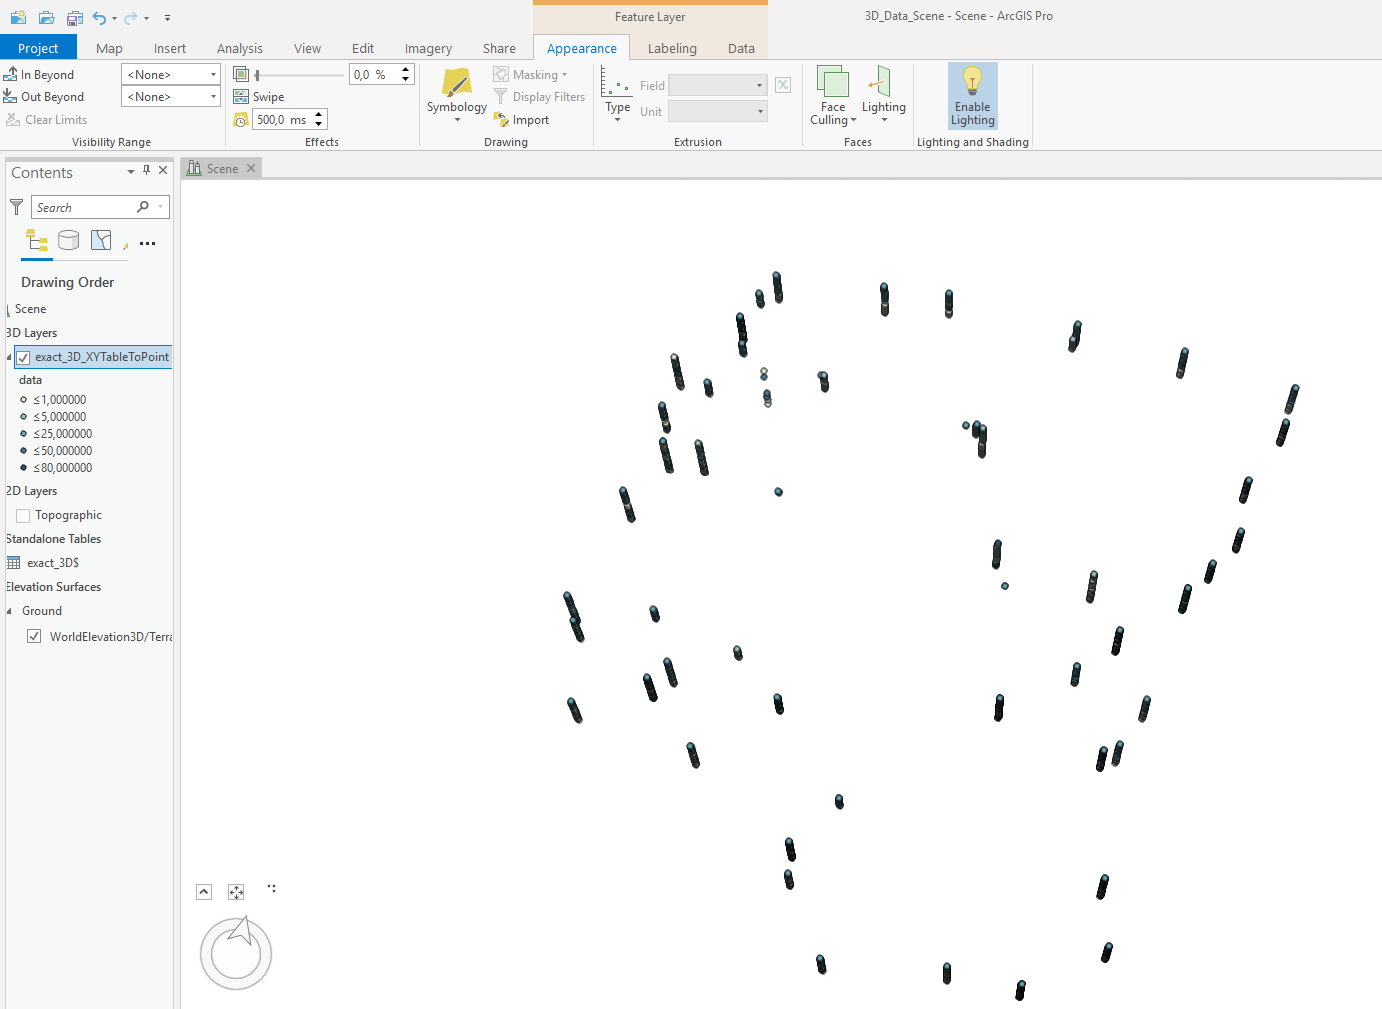
Hey Philip,
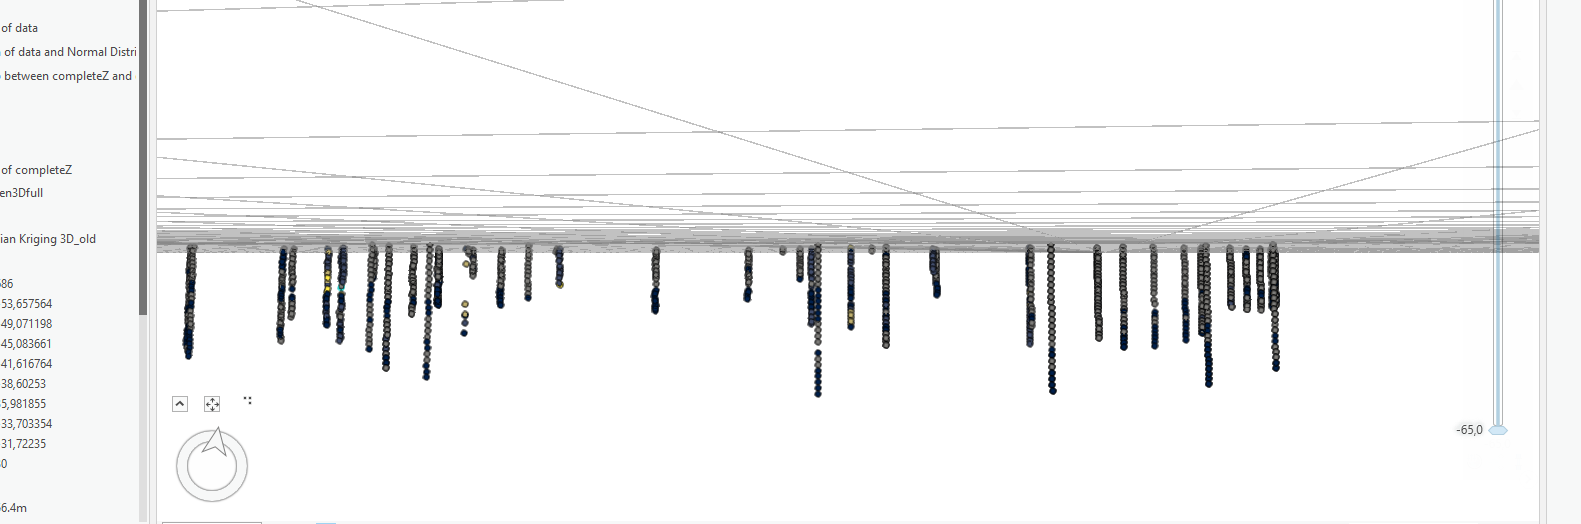
thanks a lot for you elaborate reply! Actually, all I needed to do was uncheck this ground elevation surface box.. I cannot find the navigate underground checkbox you mention, but anyway problem is solved (see pic below).
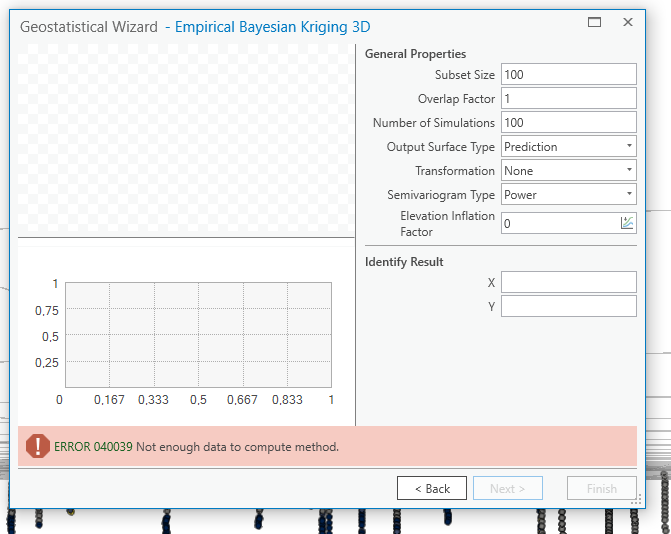
I tried to use the 3D EBK tool before. However, it tells me I do not have enough data to perform the analysis (see 2nd pic). If you would have an idea for a work-around around this I would be very greatful.
For now, I have started my analysis in 2D: I have subdivided the data in layers and analyse each separately. The layer that I am looking at is a semi-permeable aquitard: it consists of a number of clay lenses overlaying each other. (I used indicator kriging in 2d, simply saying clay=1, sand=0) As it is a sedimentary basin, the clay lenses have been deposited in the x-y plane, which would justify my 2D analysis. However, the clay layers might be ever so slightly tilted, and by looking in 2D I might be missing continuities that will actually have a great influence on the groundwater flow. SO, if I could use 3D EBK, where one can separate the domain in smaller overlapping domains and adjust the elevation inflation factor, that would be great. 🙂 Having not enough data to do the analysis thoroughly doesn't bother me to much.., as I just want to use the analysis for finding some sort of range, a few 'this might be possible' scenarios which I can use for a few different conceptual models for the flow study.
Curious what you may think about this!
Suzanne
- Mark as New
- Bookmark
- Subscribe
- Mute
- Subscribe to RSS Feed
- Permalink
Hi Suzanne,
I can try to help you with the problems you're having in EBK3D. First, a quick clarification for something earlier. EBK3D uses the geometry of the features for the calculations, so it is not affected by visualization settings in the scene like vertical exaggeration.
As for why you are seeing the error about not having enough data, I can see in your picture that you have plenty of points (only 10 valid values are required). Only two things come to mind that could cause this error.
- Accidentally leaving on a selection or definition query
- Providing an input field or elevation field where almost all values are null (both fields must have non-null values for a point to be included in the model). Note that the elevation field is used to specify the z-coordinates of the features, and it defaults to Shape.Z if the points are z-enabled.
Please let me know if neither of these resolves the problem. A screenshot of the attribute table of the points and a screenshot of the first page of the Geostatistical Wizard with parameters filled out might help me identify the problem.
Thanks,
Eric
- Mark as New
- Bookmark
- Subscribe
- Mute
- Subscribe to RSS Feed
- Permalink
Hi Suzanne-
Good advice from Eric above.
You can see those clay lenses really well as isosurfaces in the Voxel experience. Sounds like my scenario is identical to yours. I treated the numeric values for the data the same way (SPTN values).
- Mark as New
- Bookmark
- Subscribe
- Mute
- Subscribe to RSS Feed
- Permalink
Dear Eric and Phil,
Again, thanks a lot for both of your inputs.
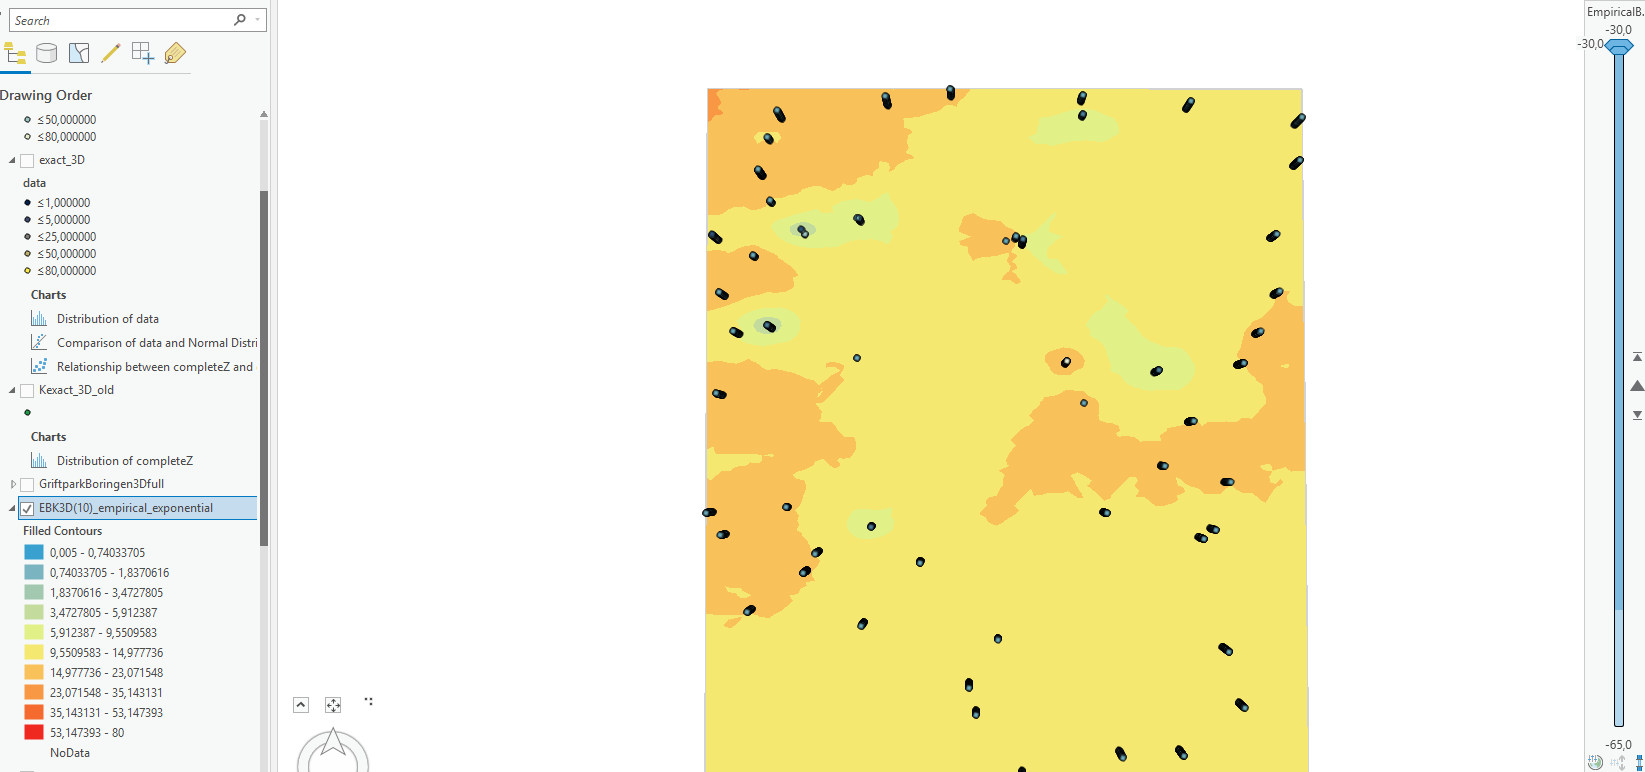
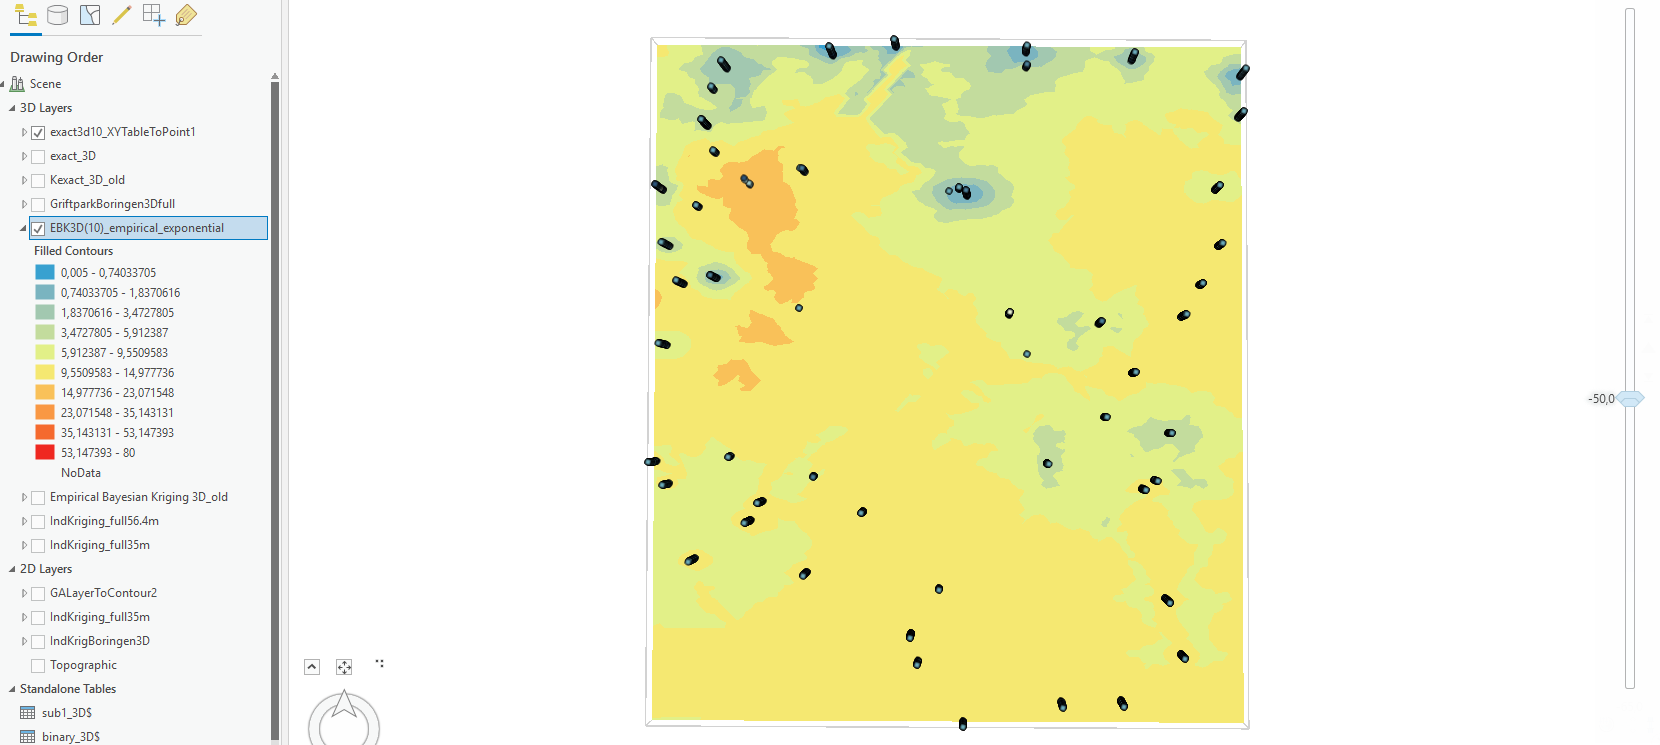
For the most bottom layers of my data I had fewer than 10 data points. I have now left these layers out and it works 🙂 I looked at the predication map and used the empirical transformation and an exponential semivariogram model type (I didn't see a big decrease in the error when I used K-Bessel.).
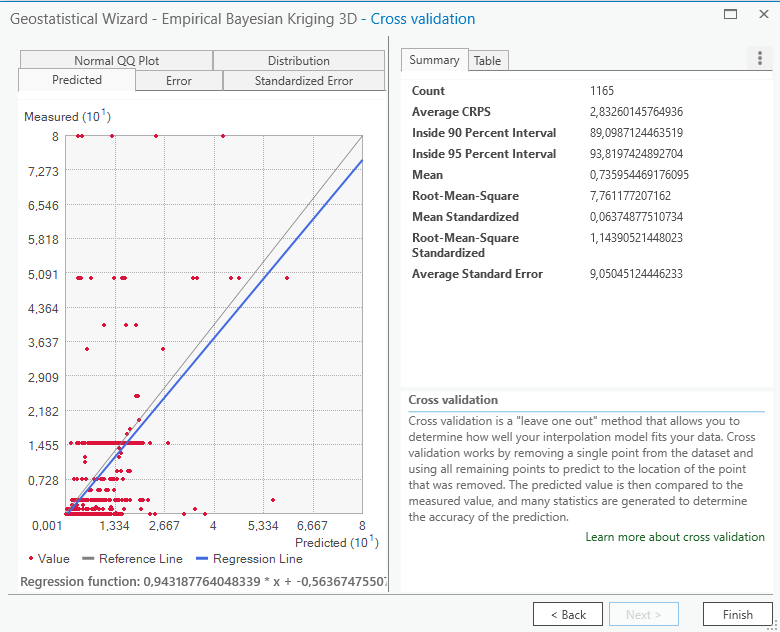
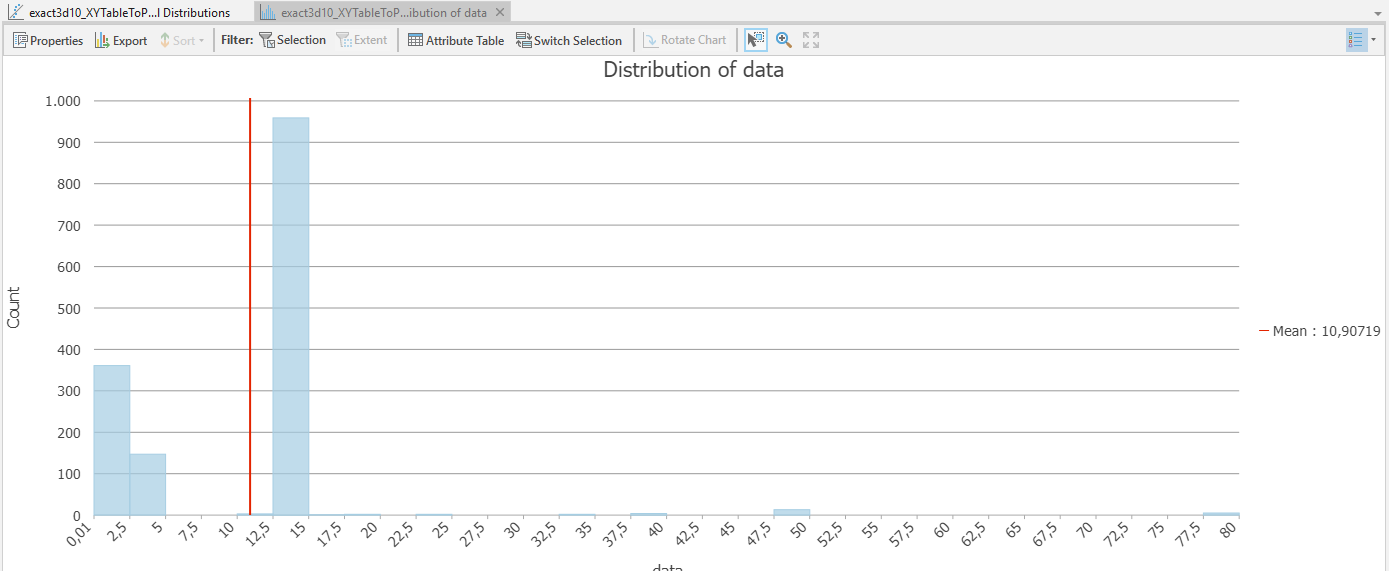
See pictures below (at 30, 50 and 59m-bg resp). I also included two screen shots of the EBK analysis and the histogram of my data. Looking at the prediction vs measurement map, the EBK results also don't seem amazing (to my unexperienced eye). I am wondering to what extend the locations of my data points have to do with that. As you can see from the top view, they are not very evenly distributed.
Prediction maps:

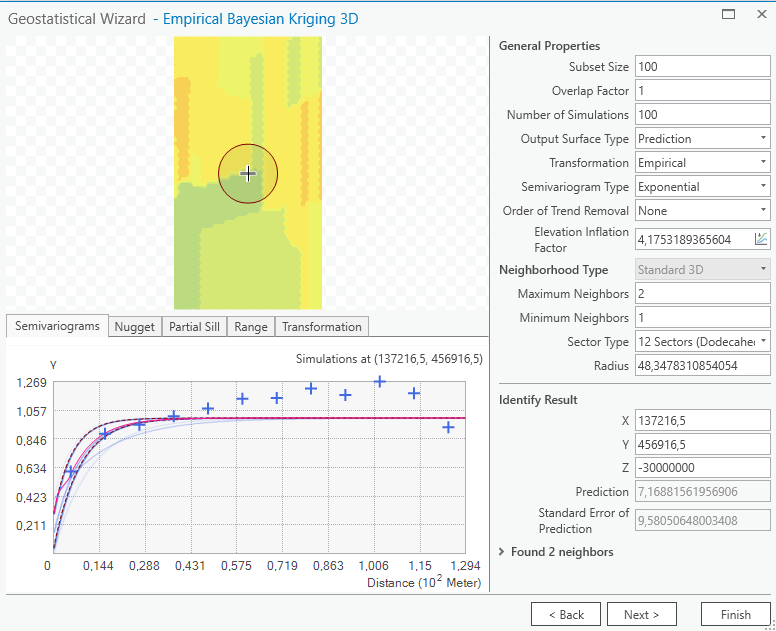
EBK 3D analysis:
Histogram of my data:
Of course now I have some new questions..
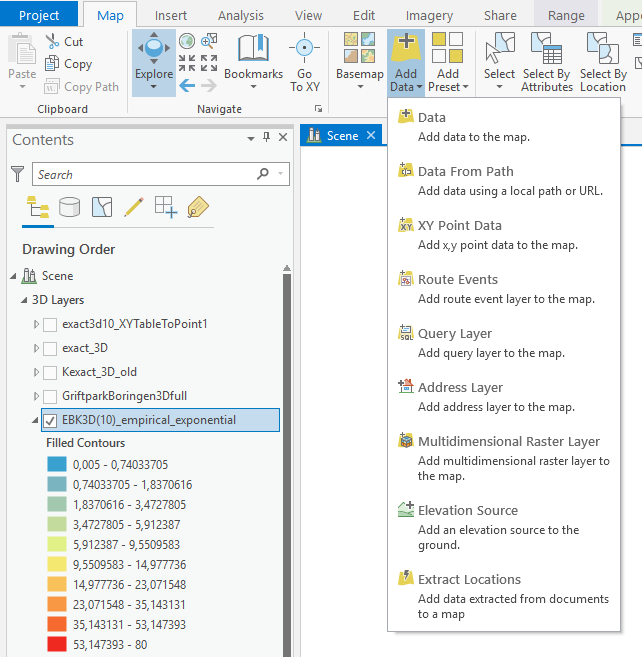
Question 1. I would love to create an isosurface in voxel space as Phil suggested, I saw the esri video on it and it looks really amazing. But how? According to the esri website I should find the option under the add data tab, but I only find the multidimensional raster layer.
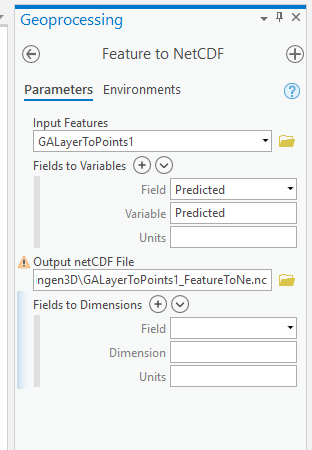
I thought I start by trying out this multidimensional raster layer. I first created a netCDF file by exporting the 3D EBK results as point features, but I get an error when uploading. This might have to do with the fact that I don't know what to fill in under the 'feature to netcdf' menu.. Phil, I would be very curious to learn how you create isosurfaces in voxel experience.
Question 2: The EBK supplies us with an optimal fit to the data. If I would want to create different fields (to have best- and worst case scenarios) I understand I need to look at quantile surfaces, in which I could choose to study what my outcomes may be if my measurement values are either over- or under estimated. Condition for using quantile surface is that a multivariate normal distribution can be assumed. I am not sure what that means in my case, after all, I have used the empirical transformation to be able to work around the fact that my data is not normally distributed.
Very greatful for your support!
Suzanne