- Home
- :
- All Communities
- :
- Products
- :
- 3D
- :
- 3D Questions
- :
- Calculating gradient along a line using Points and...
- Subscribe to RSS Feed
- Mark Topic as New
- Mark Topic as Read
- Float this Topic for Current User
- Bookmark
- Subscribe
- Mute
- Printer Friendly Page
Calculating gradient along a line using Points and Raster?
- Mark as New
- Bookmark
- Subscribe
- Mute
- Subscribe to RSS Feed
- Permalink
Ok. I am not sure what the best route is to go about this.
I have collected line features (basically streams I walk along) and they have zvalues. So I have a set of lines...
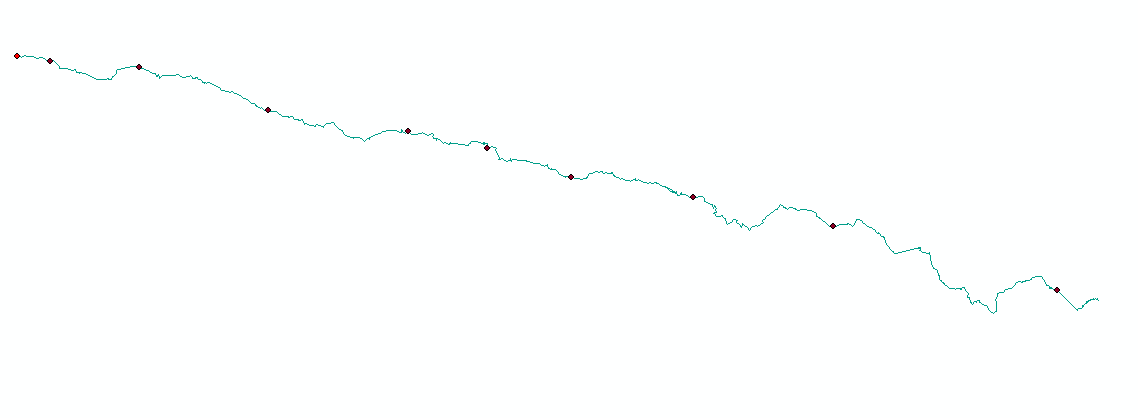
I then made a set of points called Reach_Boundary. These are the up stream boundaries of a segment of the stream line. But they are just points. I have these points snapped right to the line. The upper boundary of segment 2 is the bottom boundary for 3, and so on up the line.. I also have a point file called Stream_Mouths that serve as the bottom boundary of the first stream line segment. This picture is an example of the data. THe line is the stream line with z information, and the points are segment boundaries. Notice on the far left point it is a brighter shade of Red, this is the stream mouth point, which is also the downstream boundary for the first segment. A segment is any portion between the lines..
I need to get a slope gradient for each segment. Should I first merge my point files, so the Stream_Mouth point and the Reach_boundary points are all in one feature class?
Then would I convert my line work into a raster, and use the points to extract values? My though is I could make a new column in the stream boundary point feature called Start_ELEV, and END_ELEV then create a new column called GRAD which would be populated by taking the (differrence between start Elev and End elev and dividing that by the length of the segment) (aka Rise/run).
Anyone think of a different way? Im brainstorming...
- Mark as New
- Bookmark
- Subscribe
- Mute
- Subscribe to RSS Feed
- Permalink
Actually I have another Idea. Because I have all the associated other habitat data for these "segments" in a spreadsheet, I can actually just extract the elevation values for the points, then copy those into my spreadsheet and get the gradient figures from there....