- Home
- :
- All Communities
- :
- Products
- :
- 3D
- :
- 3D Mapping Questions
- :
- 3D Visualization of Customer Density Points
- Subscribe to RSS Feed
- Mark Topic as New
- Mark Topic as Read
- Float this Topic for Current User
- Bookmark
- Subscribe
- Mute
- Printer Friendly Page
- Mark as New
- Bookmark
- Subscribe
- Mute
- Subscribe to RSS Feed
- Permalink
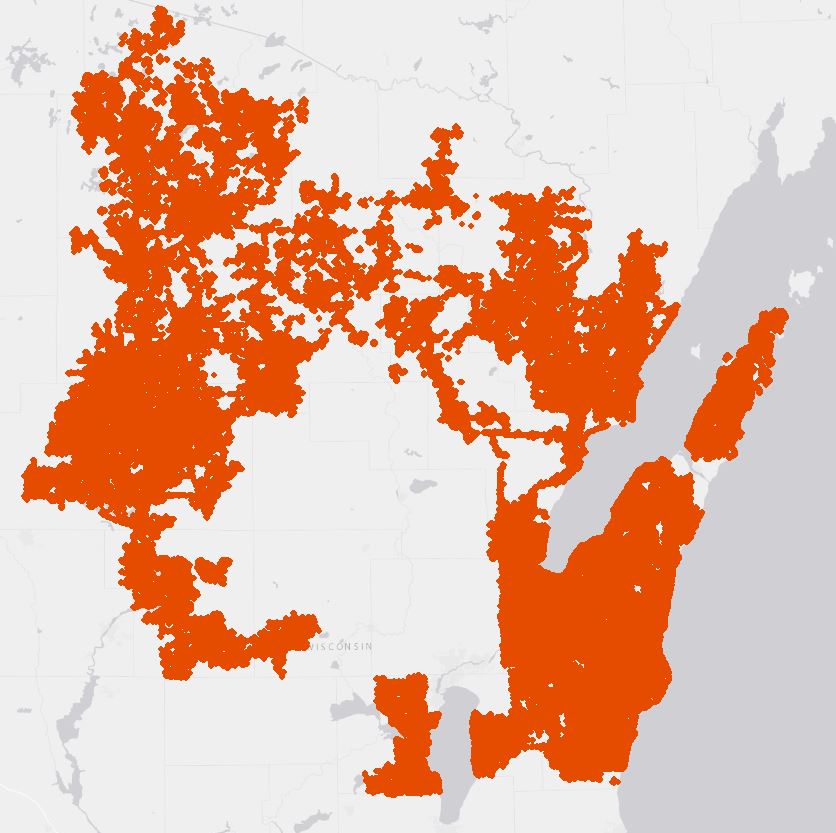
I’m looking to create a 3D type visualization that would show gas and electric customer densities. Ideally, we’d have gas and electric shaded differently, but on the same map so the large metro areas would look like mountains and smaller towns might look like a small plateau. Currently I have the customers mapped as points with about 315,000 gas customer points and 391,000 gas customer points spread across approx 12,000 sq miles. The final scene would be published to an app in AGO or Enterprise/Portal. Any help is much appreciated.
Thank you!
Melissa
Solved! Go to Solution.
Accepted Solutions
- Mark as New
- Bookmark
- Subscribe
- Mute
- Subscribe to RSS Feed
- Permalink
Hello Melissa!
One visualization method that comes to mind would be feature extrusion. This is exactly what it sounds like, extruding the 2D features upward into the air based on a specified attribute field. This can be done on both your point and polygon feature class. At the URL below you can find information about how exactly to achieve this.
Extrude features to 3D symbology—ArcGIS Pro | Documentation
I hope this helps!
Lukas