- Home
- :
- All Communities
- :
- ArcGIS Topics
- :
- GIS Life
- :
- GIS Life Blog
- :
- ArcGIS JavaScript Tutorial - use watch handler on ...
ArcGIS JavaScript Tutorial - use watch handler on scale of view
- Subscribe to RSS Feed
- Mark as New
- Mark as Read
- Bookmark
- Subscribe
- Printer Friendly Page
listMode: show or hide
OK - This is a nice one to share, I think. The question is:
I have two layers in my file that are scale dependent. How can I force the layerlist widget to only show that layer when the user is zoomed in to the point that the layer is visible and able to be turned on and off?
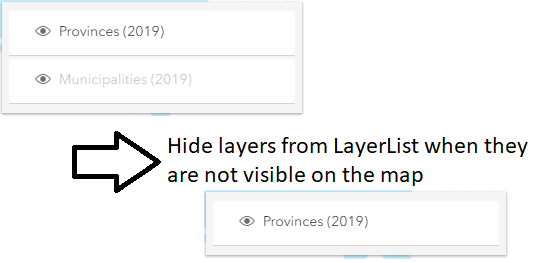
We will show how to do this. As you can see in the code of the web map below, for one of the feature layers in the view (the municipalities) the minScale (minimum scale) is set to 500000. This means that if the view is zoomed out beyond the scale of 1:500,000 that layer will no longer be visible in the view.
By default, layers that are present but not visible in the view are grayed out in the LayerList. But now we do NOT want to show invisible layers at all in this list and only add them at scales where they are visible.
The trick to accomplish this, is:
- 'watch' the scale of the map with a watch handler
- set the listMode of the layer to hide or show accordingly.
And this is the code needed to do this trick:
// watch handler: the callback fires each time the scale of the view changes
var handle = view.watch('scale', function(newScale) {
console.log("Scale: ", newScale);
if (newScale > 500000) {
dutchMunicipalitiesLayer.listMode = 'hide';
} else {
dutchMunicipalitiesLayer.listMode = 'show';
}
});You can see the full solution in action via this link:
ArcGIS JavaScript Tutorial - Scale dependent layers visibility in LayerList
And the full code (html, css and javascript) is listed below:
<!DOCTYPE html>
<html>
<head>
<meta charset="utf-8">
<meta name="viewport" content="initial-scale=1, maximum-scale=1, user-scalable=no">
<title>ArcGIS JavaScript Tutorial - Scale dependent layers visibility in LayerList</title>
<style>
html, body, #viewDiv {
padding: 0;
margin: 0;
height: 100%;
width: 100%;
}
</style>
<link rel="stylesheet" href="https://js.arcgis.com/4.12/esri/css/main.css">
<script src="https://js.arcgis.com/4.12/"></script>
<script>
require([
"esri/Map",
"esri/geometry/Point",
"esri/views/MapView",
"esri/layers/FeatureLayer",
"esri/widgets/LayerList"
], function(Map, Point, MapView, FeatureLayer, LayerList) {
var map = new Map({
basemap: {
portalItem: {
id: "7aea6fa913a94176a1074edb40690318" // Topo RD
}
}
});
var popupTemplate = { // autocasts as new PopupTemplate()
title: "The municipality of {Gemeentenaam}",
content: "Municipal Code: {GM_Code}"
};
var renderer = {
type: "simple", // autocasts as new SimpleRenderer()
symbol: {
type: "simple-fill", // autocasts as new SimpleFillSymbol()
style: "none", // The polygon has no fill
outline: { // autocasts as new SimpleLineSymbol()
width: 1.5,
color: "#F5B041" // Hex Color Code
}
}
};
var dutchMunicipalitiesLayer = new FeatureLayer({
url: "https://services.arcgis.com/nSZVuSZjHpEZZbRo/arcgis/rest/services/Bestuurlijke_Grenzen_Gemeenten_2019/FeatureServer/0",
title: "Municipalities (2019)",
popupTemplate: popupTemplate,
renderer: renderer,
minScale: 500000
});
popupTemplate.title = "The province of {Provincienaam}";
popupTemplate.content = "";
renderer.symbol.outline.width = 2.5;
renderer.symbol.outline.color = "#8B4513";
var dutchProvincesLayer = new FeatureLayer({
url: "https://services.arcgis.com/nSZVuSZjHpEZZbRo/ArcGIS/rest/services/Bestuurlijke_Grenzen_Provincies_2019/FeatureServer/0",
title: "Provinces (2019)",
popupTemplate: popupTemplate,
renderer: renderer
});
map.addMany([dutchMunicipalitiesLayer, dutchProvincesLayer]);
var view = new MapView({
spatialReference: 28992,
container: "viewDiv",
map: map,
center: new Point({x: 155000, y: 463000, spatialReference: 28992}),
zoom: 3
});
var layerList = new LayerList({
view: view
});
view.ui.add(layerList, {
position: "top-right"
});
// watch handler: the callback fires each time the scale of the view changes
var handle = view.watch('scale', function(newScale) {
console.log("Scale: ", newScale);
if (newScale > 500000) {
dutchMunicipalitiesLayer.listMode = 'hide';
} else {
dutchMunicipalitiesLayer.listMode = 'show';
}
});
});
</script>
</head>
<body>
<div id="viewDiv"></div>
</body>
</html>You must be a registered user to add a comment. If you've already registered, sign in. Otherwise, register and sign in.