- Subscribe to RSS Feed
- Mark as New
- Mark as Read
- Bookmark
- Subscribe
- Printer Friendly Page
Have you every come across a situation like one of these:
- you need to test out something but don't have the data
- are you sick of trying to get a function to work in the field calculator
- you want to test out one of ArcMap's functions but none of your data are suitable
- all I need are some points which have a particular distribution
- someone forgot to post a sample of their data on GeoNet for testing and you don't have a match
- you forgot to collect something in the field

Well, this lesson is for you. It is a culmination of a number of the previous lessons and a few
NumPy Snippets and Before I Forget posts. I have attached a script to this post below
There is also a GitHub repository that takes this one step further providing more output options... see Silly on GitHub
The following provides the basic requirements to operate a function should you choose not to
incorporate the whole thing. Obviously, the header section enclosed within triple quotes
isn't needed but the import section is.
# -*- coding: UTF-8 -*-
"""
:Script: random_data_demo.py
:Author: Dan.Patterson AT carleton.ca
:Modified: 2015-08-29
:Purpose:
: Generate an array containing random data. Optional fields include:
: ID, Shape, text, integer and float fields
:Notes:
: The numpy imports are required for all functions
"""
#-----------------------------------------------------------------------------
# Required imports
from functools import wraps
import numpy as np
import numpy.lib.recfunctions as rfn
np.set_printoptions(edgeitems=5, linewidth=75, precision=2,
suppress=True,threshold=5,
formatter={'bool': lambda x: repr(x.astype('int32')),
'float': '{: 0.2f}'.format})
#-----------------------------------------------------------------------------
# Required constants ... see string module for others
str_opt = ['0123456789',
'!"#$%&\'()*+,-./:;<=>?@[\\]^_`{|}~',
'abcdefghijklmnopqrstuvwxyz',
'ABCDEFGHIJKLMNOPQRSTUVWXYZ',
'abcdefghijklmnopqrstuvwxyzABCDEFGHIJKLMNOPQRSTUVWXYZ'
]
#-----------------------------------------------------------------------------
# decorator
def func_run(func):
"""Prints basic function information and the results of a run.
:Required: from functools import wraps
"""
@wraps(func)
def wrapper(*args,**kwargs):
print("\nFunction... {}".format(func.__name__))
print(" args.... {}\n kwargs.. {}".format(args, kwargs))
print(" docs.... \n{}".format(func.__doc__))
result = func(*args, **kwargs)
print("{!r:}\n".format(result)) # comment out if results not needed
return result # for optional use outside.
return wrapper
#-----------------------------------------------------------------------------
# functions
Before I go any further, lets have a look at the above code.
- line 14 - functools wraps module - I will be using decorators to control output and wraps handles all the fiddly stuff in decorators (see Before I Forget # 14)
- line 16 - - numpy.lib.recfunctions is a useful module for working with ndarrays and recarrays in particular...it is imported as rfn
- lines 17-20 - np.set_printoptions allows you to control how arrays are formatted when printing or working from the command line. Most of the parameters are self-explanatory or you will soon get the drift
- lines 30 - 43 - the decorator function presented in BIF # 14.
Now back to the main point. If you would like to generate data with some control on the output.
This will present some functions to do so and put it together into a standalone table or feature class.
An example follows:
Array generated....
array([(0, (7.0, 1.0), 'E0', '(0,0)', 'A', 'ARXYPJ', 'cat', 'Bb', 0, 9.380410289877375),
(1, (2.0, 9.0), 'D0', '(4,0)', 'B', 'RAMKH', 'cat', 'Aa', 9, 1.0263298179133362),
(2, (5.0, 8.0), 'C0', '(1,0)', 'B', 'EGWSC', 'cat', 'Aa', 3, 2.644448491753841),
(3, (9.0, 7.0), 'A0', '(1,0)', 'A', 'TMXZSGHAKJ', 'dog', 'Aa', 8, 6.814471938888746),
(4, (10.0, 3.0), 'E0', '(1,0)', 'B', 'FQZCTDEY', '-1', 'Aa', 10, 2.438467639965038)],
............. < snip >
dtype=[('ID', '<i4'), ('Shape', [('X', '<f8'), ('Y', '<f8')]),
('Colrow', '<U2'), ('Rowcol', '<U5'), ('txt_fld', '<U1'),
('str_fld', '<U10'), ('case1_fld', '<U3'), ('case2_fld', '<U2'),
('int_fld', '<i4'), ('float_fld', '<f8')])
Here are the code snippets...
| Code snippets |
|
|
|
|
|
|
|
|
The above functions can be used with the main portion of the script and your own function.
| Sample function |
|
|
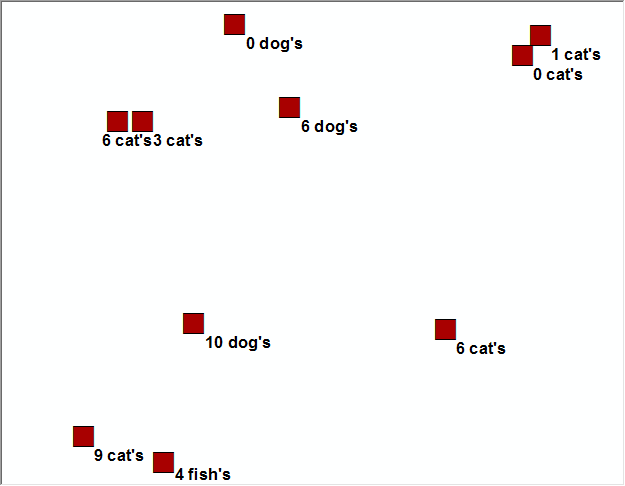
You will notice in the above example that the rand_case function was to determine
the number of pets based upon p-values of 0.6, 0.3 and 0.1, with cats being favored, as they should be, and
this is reflected in the data. The coordinates in this example were left as integers, reflecting a 1m resolution.
It is possible to add a random pertubation of floating point values in the +/- 0.99 to add centimeter values if you desire.
This is not shown here, but I can provide the example if needed.
The 'Number' field in this example simply reflects the number of pets per household.
Homework...
Using NumPyArrayToFeatureclass, create a shapefile using a NAD_1983_CSRS_MTM_9 projection
(Projected, National Grids, Canada, NAD83 CSRS_MTM_9)
Answer...
>>> import arcpy
>>> a = blog_post() # do the run if it isn't done
>>> # ..... snip ..... the output
>>> # ..... snip ..... now create the featureclass
>>> SR_name = 32189 # u'NAD_1983_CSRS_MTM_9'
>>> SR = arcpy.SpatialReference(SR_name)
>>> output_shp ='F:/Writing_Projects/NumPy_Lessons/Shapefiles/out.shp'
>>> arcpy.da.NumPyArrayToFeatureClass(a, output_shp, 'Shape', SR)
Result
That's all...
You must be a registered user to add a comment. If you've already registered, sign in. Otherwise, register and sign in.