- Home
- :
- All Communities
- :
- Products
- :
- ArcGIS Spatial Analyst
- :
- ArcGIS Spatial Analyst Questions
- :
- Re: How to find Elevation difference along the riv...
- Subscribe to RSS Feed
- Mark Topic as New
- Mark Topic as Read
- Float this Topic for Current User
- Bookmark
- Subscribe
- Mute
- Printer Friendly Page
How to find Elevation difference along the river line?
- Mark as New
- Bookmark
- Subscribe
- Mute
- Subscribe to RSS Feed
- Permalink
- Report Inappropriate Content
Dear GIS experts,
I would be very thankful to receive your help/support/suggestion for solving my following problem. I'm using ArcGIS 10.1 with Spatial Analyst and 3D Analyst(no ArcInfo license) and Arcview 3x (still for many plusses).
I have a river network - both a shape file and raster grid - generated from a DEM through Flow Direction and Flow Accumulation grid for a very big region (a country).
What I want to know/calculate is - for every river cell, what is the difference in elevation value between the elevation of that river cell and the elevation of the river cell at a given distance (say, 1 km, 2km, 5km) downstream from that river cell along that river i.e. flow direction?
I tried to do this by using the focal statistic function running over the River-DEM (using minimum as statistic) and then subtracting the resulting grid from the original River-DEM; but this dos not work completely correctly because at many places the minimum in the neighbourhood is found in the adjacent river (tributary or another parallel river at another side of the ridge) and it gives me wrong elevation difference because the minimum river cell is not in the same river downstream but in another river although within the defined search/neighbhourhood distance. How can I get this correctly- i.e. the elevation difference in the same river downstream in a given distance?
I hope that I could make this my problem sufficiently clear. What would be your suggestion to solve this?
Thanking you a lot!!
Solved! Go to Solution.
- Mark as New
- Bookmark
- Subscribe
- Mute
- Subscribe to RSS Feed
- Permalink
- Report Inappropriate Content
Hi Pawan Thapa , thanks for sharing the data.
This is what I have come up with. Part of the process was done manually, but a large part of that can be easily automated.
Since the raster data did not have any spatial reference defined I simply assigned one, although it will probably not be the correct one.
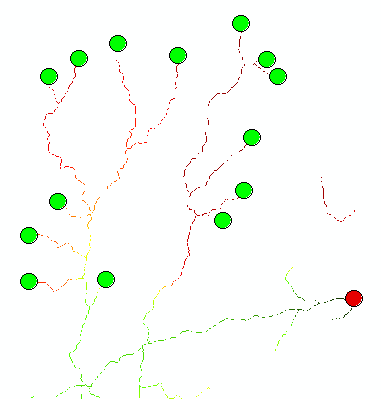
I created 2 featureclasses; one with the outlet of the network (red point) and one with some of the inlets (green points):
Then I took your flowdir raster and created a new raster called cost that simply has value 1 where the rivers are defined and NoData for all the other pixels. Python snippet:
arcpy.gp.RasterCalculator_sa('Con("flowdir", 1)', "C:/GeoNet/DEMstreams/test.gdb/cost")Next I used this raster in a Cost Distance calculation to generate a cost distance and backlink raster. Python snippet:
arcpy.gp.CostDistance_sa("outlet", "cost", "C:/GeoNet/DEMstreams/test.gdb/CostDist", "", "C:/GeoNet/DEMstreams/test.gdb/Backlink", "", "", "", "", "")The following step was a Cost Path on a single inlet to obtain the route from the inlet to the outlet. Python snippet:
arcpy.gp.CostPath_sa("inlets", "CostDist", "Backlink", "C:/GeoNet/DEMstreams/test.gdb/CostPath_oid01", "EACH_CELL", "OBJECTID")This raster I converted to vector to get the line (not applying simplification):
arcpy.RasterToPolyline_conversion(in_raster="CostPath_oid01", out_polyline_features="C:/GeoNet/DEMstreams/test.gdb/path_oid01a", background_value="ZERO", minimum_dangle_length="0", simplify="NO_SIMPLIFY", raster_field="Value")The resulting featureclass has two features and the one with the longest length (OID=2) is the one we need. However, the data does not have any z values, so I added them with the Interpolate shape 3D tool. Python snippet:
arcpy.InterpolateShape_3d(in_surface="rivdem", in_feature_class="path_oid01a", out_feature_class="C:/GeoNet/DEMstreams/test.gdb/path_oid01a_3d", sample_distance="", z_factor="1", method="BILINEAR", vertices_only="VERTICES_ONLY", pyramid_level_resolution="0")Now we have a line that has z values and we are ready to start the process. The next part is to evaluate each of the vertices of the line and find the corresponding point 1, 2 or 5 km further along the river and compare the heights. For this I created the following code:
def main():
import arcpy
import os
arcpy.env.overwriteOutput = True
fc = r'C:\GeoNet\DEMstreams\test.gdb\path_oid01a_3d'
oid_line = 2
fc_out = r'C:\GeoNet\DEMstreams\test.gdb\result_v05'
# output fields
fld_ed1km = "ElevationDrop1km"
fld_ed2km = "ElevationDrop2km"
fld_ed5km = "ElevationDrop5km"
# create output fc
sr = arcpy.Describe(fc).spatialReference
ws, fc_name = os.path.split(fc_out)
arcpy.CreateFeatureclass_management(ws, fc_name, "POINT", None, "ENABLED", "ENABLED", sr)
# add fields
arcpy.AddField_management(fc_out, fld_ed1km, "DOUBLE")
arcpy.AddField_management(fc_out, fld_ed2km, "DOUBLE")
arcpy.AddField_management(fc_out, fld_ed5km, "DOUBLE")
# create list M,Z for easy data access
lst_mz = []
fld_oid = arcpy.Describe(fc).OIDFieldName
where = "{0} = {1}".format(fld_oid, oid_line)
polyline = arcpy.da.SearchCursor(fc, ('SHAPE@'), where).next()[0]
for part in polyline:
for pnt in part:
m = polyline.measureOnLine(pnt, False)
z = pnt.Z
lst_mz.append([m, z, pnt]) #
print "Records to process:", len(lst_mz)
## print lst_mz
## exit("bailing out...")
# start insert cursor
flds = ('SHAPE@', fld_ed1km, fld_ed2km, fld_ed5km)
with arcpy.da.InsertCursor(fc_out, flds) as curs:
# evaluate each point
cnt = 0
for lst in lst_mz:
cnt += 1
if cnt % 10 == 0:
print "Processing vertex: ", cnt, drop_1km, drop_2km, drop_5km
m = lst[0]
z = lst[1]
pnt = lst[2]
drop_1km = GetDropatM(lst_mz, z, m + 1000, cnt - 1)
drop_2km = GetDropatM(lst_mz, z, m + 2000, cnt - 1)
drop_5km = GetDropatM(lst_mz, z, m + 5000, cnt - 1)
pntg = arcpy.PointGeometry(arcpy.Point(pnt.X, pnt.Y, z, m), sr)
curs.insertRow((pntg, drop_1km, drop_2km, drop_5km, ))
def GetDropatM(lst_mz, z, m_search, i_init):
# first find the points nearest to given m value (m_search)
index = i_init
m = 0
ok = True
while m < m_search:
if index < len(lst_mz):
lst = lst_mz[index]
m = lst[0]
index += 1
else:
# no value available
ok = False
break
if ok:
m_start = lst_mz[index - 2][0]
m_end = lst_mz[index - 1][0]
# print "M:", m_search, m_start, m_end
z_start = lst_mz[index - 2][1]
z_end = lst_mz[index - 1][1]
# print "Z:", z, z_start, z_end
z_search = (m_search - m_start) / (m_end - m_start) * z_start + (m_end - m_search) / (m_end - m_start) * z_end
return z - z_search
else:
return None
if __name__ == '__main__':
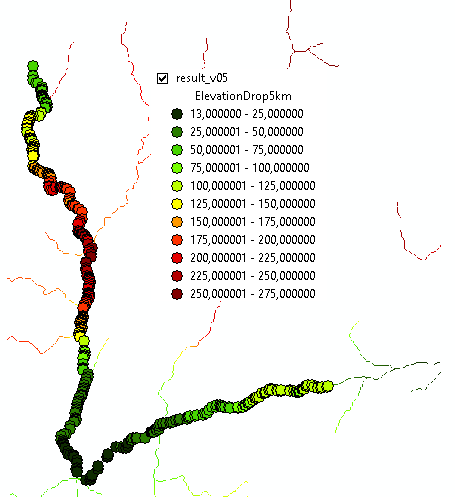
main()The result is a featureclass with all the vertices and for each vertice the drop at 1, 2 and 5 km is calculated. The result displayed using the drop in 5 km field:
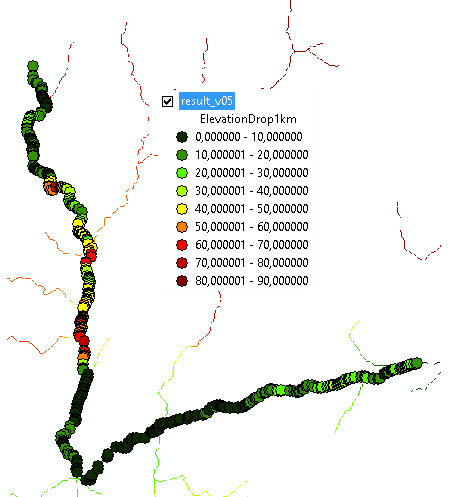
Drop at 1km:
- Mark as New
- Bookmark
- Subscribe
- Mute
- Subscribe to RSS Feed
- Permalink
- Report Inappropriate Content
Wow Xander, this is awesome. What a shame the OP never responded to indicate if it was the solution they needed.
- Mark as New
- Bookmark
- Subscribe
- Mute
- Subscribe to RSS Feed
- Permalink
- Report Inappropriate Content
Hi sfox_cpud ,
It sometimes happens that an OP does not respond to a possible solution (you may call it a "hit and run"), but I like to think that a possible solution might be useful not only to the OP but to others too. And in this case, thinking about this solution has helped me to create ideas that have been implemented at clients. So I don't feel I have wasted my time in any way. Thank for the shout out!
- « Previous
-
- 1
- 2
- Next »
- « Previous
-
- 1
- 2
- Next »