If you’ve used the Migrate To Utility Network tool to migrate your gas or water data into a utility network, you’re likely asking yourself: What configuration typically do I need to perform on this utility network to make it behave like a pressurized network? These systems are typically used to move liquids or gases through pressurized pipe networks. Analysis workflows for these datasets often involve determining how to isolate portions of the network, analyzing the maximum capacity of the pipe network, and how well the network supports the intended area.
In this article we will show you how you can take a model produced by the Migrate To Utility Network tool and extend it to support some of these basic workflows. The examples in this article show a water dataset, but the concepts and techniques apply to any pressurized network.
Network Categories
One of the most important network analysis business requirements for water and gas customers is the ability to perform an isolation trace on their network data to identify customers impacted by an outage, regardless of whether it’s planned or unplanned. The geometric network was able to perform an approximation of an isolation trace using its connectivity model. Using a utility network, we can recreate this behavior by using a connectivity trace that is configured to stop when it encounters a valve.
Below you can see an area of the network we want to isolate to repair a fitting on the main below. The area we need to isolate is indicated on the map with a green circle.

By starting a trace at the location we want to isolate (the green circle) and running a connectivity trace that stops at system valves you can reproduce the same result as seen with the geometric network. You can do this by adding a condition barrier to the trace that tells the trace when it should stop the analysis. Fortunately, the migration tool creates network categories for each asset group that can be used when configuring traces.

Running a connected trace that stops at system valves is an approximation of an isolation trace.
However, an isolation trace should consider many valves (emergency, bypass, etc), not only system valves. While you could configure our trace to reference all the different asset group and asset type combinations, it would be quite cumbersome to list them. Fortunately, the utility network allows you to create and assign network categories to asset types in your model, to control tracing. In this way it can identify and interact with common types of equipment, without the need to remember all their codes.
To do this, you start by creating a new network category for isolating equipment called Isolation using the Add Network Category tool.

Once you’ve created the network category, then use the Set Network Category tool to assign it to all the asset types that are considered operable devices during an isolation trace.

Once this network category has been assigned to the different types of isolation equipment, you can now run the trace and reference the single network category instead of the individual asset types.

Once a network category is created it can be used when tracing. Any features with that network category assigned will be found by the tool.
Now that you’ve got the isolation trace working like it did in the geometric network, let's look at how we can take it a step further and take advantage of new features included in the utility network.
Create a Subnetwork Controller
It makes sense that when data is migrated from a geometric network to a utility network that this same behavior is present, with all the same limitations. In the geometric network isolation traces often relied on the basic network connectivity trace, meaning they didn’t have any knowledge of network sources. As a result, the isolation trace wouldn’t be able to recognize features downstream of the isolated area as also being isolated. You can see an example of this below.

The utility network solves this problem by allowing the definition of sources and sinks in networks, referred to as subnetwork controllers in the utility network. A subnetwork controller is responsible for a subset of the entire utility network known as a subnetwork. If you identified layers in your utility network as subnetwork controllers during your migration, or if your geometric network contained sources or sinks, then you will have the configuration in place to turn features in those layers into subnetwork controllers.
If you didn’t define any asset types as controllers during mapping when you ran the Migrate To Utility Network tool, you will either need to rerun the tool with the option selected or manually configure at least one asset type as a subnetwork controller using the instructions outlined in the Set a subnetwork controller page in the online help.
In the case of this dataset, you can create the water treatment plant as a subnetwork controller for the entire water distribution system. To do this you can use the Modify Subnetwork Controller pane to set the downstream terminal of the treatment plant as a subnetwork controller for a new subnetwork called the Naperville Distribution System and name this subnetwork controller the Firemens Treatment Plant.

After clicking apply you can see that a dirty area Is created for the treatment plant that we need to validate to ensure the network is aware this new subnetwork controller exists.

After validating the new controller, you can now take advantage of all the trace types in the utility network that require a subnetwork controller. This includes subnetwork, subnetwork controller, upstream, downstream, and isolation traces. By selecting the subnetwork you created in the Trace tool and clicking run, you can see all the features that are connected to this treatment plant, which should be the entire network.

A subnetwork trace will select all the features that belong to that subnetwork.
Returning to our original example, you can now produce the correct result to return isolated areas downstream of the isolated area by taking advantage of the directionality of flow the controller provides. First, select an isolation trace and tell it to use the sources of the Water System tier in the network.

Second, configure the trace to isolate the area using the isolation category you configured earlier. If you were to try and use a condition barrier, as above, you will get an error communicating the need to specify at least one filter barrier (see graphic below). This is because isolation traces use filter barriers to identify the features that are isolated, while condition barriers are used to identify the features that define the extent of the trace (e.g. the subnetwork trace).

You must specify a filter barrier to identify the features that should be used to isolate the area.
By using the isolation category as a filter barrier the trace first identifies the subnetwork controller(s) for the water system and then filters the results to include the features downstream of the filter barriers. By default, the tool will only select the features that isolate the area (e.g. the filter barriers).

By default, running an isolation trace will identify the features used to isolate the desired area (green dot).
To see all the pipes and customers that are isolated you can choose the Include Isolated Features parameter on the trace.
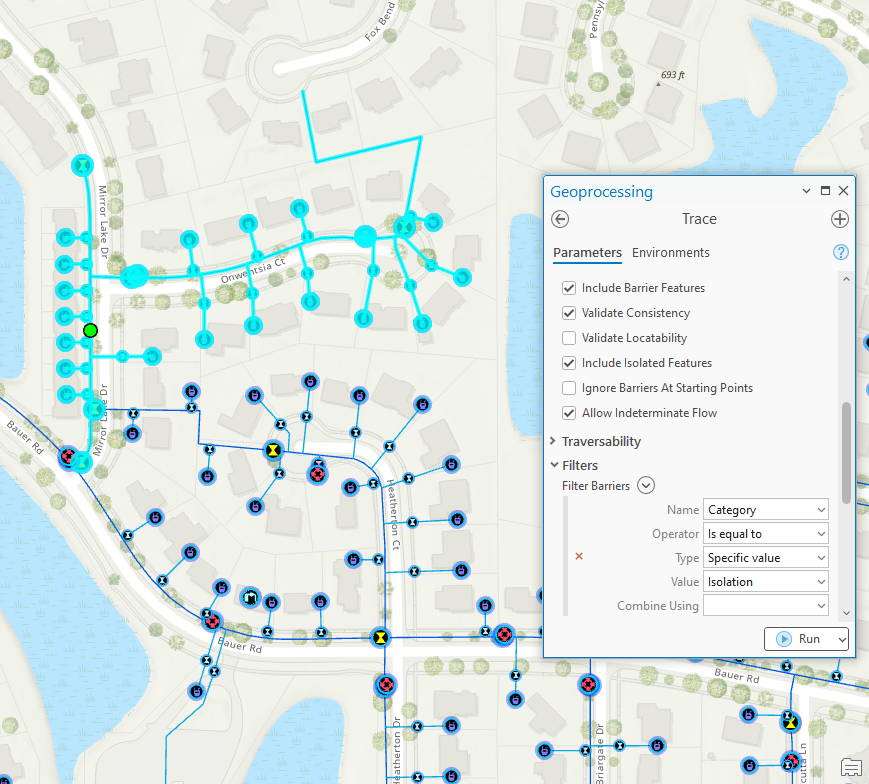
Check the include isolated features option to include the isolated features as well as the features used to isolate the desired area (green dot)
This now gives you the correct result, isolating the immediate area along with all the features downstream that can no longer access a source.
Network Attributes
If you migrated your data from a geometric network and look at your subnetwork trace dialog you will notice that there is a condition barrier set up on the Enabled field. This means that features with an Enabled value of False will act as barriers to tracing.

If you were already relying on this field for tracing, then your traces will continue to behave as they did in the geometric network. However, if you were managing information like this in another field and would like to use that field to control tracing instead of, or in addition to, the Enabled field then you can configure the utility network to act this way with just a few steps.
Pressurized systems use valves to direct the flow in the network. The field that represents whether a valve is normally open or closed is often called Normal Position or Normal Status. You may even have a field called Current Position or Current Status, but this is typically used to represent the temporary status of the network according to field crews or a network operator. So how do you incorporate this information into network analysis? You make the attribute a network attribute.
The first step to doing this is to create a new network attribute that is managed by the utility network. To do this you must disable your network topology and run the Add Network Attribute tool. When you create the network attribute you must first select a data type. This is an important selection because any field in your data you want to use to populate this attribute must have the matching data type.

Note: It is currently not possible to create a network attribute for a string field, so if your status field is a text field you will need to either create a new integer field for managing status or you should consider just using the existing network attribute configured for the enabled field.
このフォームには、ネットワーク属性がシステムテーブルにどのように格納されるかを制御する追加オプションもあります。属性をインラインで格納することはトレース中のパフォーマンスに最適ですが、インラインで格納できる属性の数には限りがあるため、このオプションは頻繁に使用し、かつBoolean(はい/いいえの値など)である属性にのみ選択すべきです。Normal Statusフィールドの場合、この動作を活用できます!テーブル内のこのフィールドはnullableなので、ネットワーク属性もnullableに設定する必要があります。そうしないとフィールドを選択できません。

より高度なワークフローでは、Operable(バルブが操作可能かどうか)、Current Status(ネットワークオペレーターが使用する状態)、またはPinchable(パイプをつまめるかどうか)などの追加属性を設定したい場合があります。しかし今は、それらの属性は飛ばして、新しいネットワーク属性を割り当てることに集中しましょう。Set Network Attributeツール。
次に、Set Network Attributeツールを開いて、新しいネットワーク属性をテーブルのNormallyOpenフィールドに割り当てます。

バルブの通常位置をトレース時に考慮できるネットワーク属性を作成したので、サブネットワークをトレースするときは常にこの属性を使用するようネットワークを構成したくなるでしょう。
Set Subnetwork definition
これを行うには、Set Subnetwork Definitionツールを開き、ユーティリティネットワーク、ドメインネットワーク、およびティアを選択します。次に、ツールのサブネットワークトレース構成セクションまでスクロールし、条件バリアでネットワーク属性を選択します。この例ではEnabledフィールドをNormal Statusフィールドに置き換えます。幸いなことに、両方とも値0をバリア(無効/閉)として扱います。

注:ネットワーク属性フィールドのクラスレベルでドメインを割り当てると、対応するドメインコードを手動で入力する代わりに、コード化値ドメインからの値がドロップダウンで表示されます。
サブネットワーク定義を更新すると、このティアでサブネットワークトレースを実行するたびに、この条件バリアがトレース構成に自動的に含まれます。Set Subnetwork Definitionツールにはサブネットワークの動作を制御する多くのプロパティがあり、これらのパラメーターは高度な構成の記事で詳しく説明されています。
Trace configuration
トレース構成を変更するとサブネットワークトレースが簡単になることがわかりましたが、頻繁に実行する異なるトレースが複数ある場合はどうでしょう?Add Trace Configurationツールを使用すると、トレース構成をデータベースに保存できるため、デスクトップ、Web、およびモバイルのユーザーがあなたが作成した同じトレースを使用できます。これを行うにはAdd Trace Configurationツールを開き、トレースを構成して名前を付け、ツールを実行して他者が利用できるようにします。今回の場合は3つの別々のトレース構成を作成します。一つはエリア隔離用バルブ表示用、もう一つは隔離されたすべてのもの表示用です。

トレース構成の作成はWebおよびモバイルユーザーとトレーシング機能を共有する迅速かつ簡単な方法です。
必要ならば、顧客用のネットワークカテゴリを作成・割り当て、そのカテゴリ用の出力条件をトレースに追加して隔離された顧客のみ選択する追加トレース構成も作成できます。

すべての名前付きトレース構成を作成したら、TraceペインのNamed Configurationsタブから素早くアクセスできます。これはトレースツール起動より便利なだけでなく、このタブ経由で実行されるトレースは実際に高速です!

Named Configurationsタブはデスクトップユーザーが名前付きトレース構成を実行するための迅速かつ簡単な方法です。
結論
これはガスや水道配給業界などで見られる加圧ネットワークに適用できる初期設定群について説明し、分析開始のお手伝いとなります。他にも圧力ゾーンや陰極保護構造など高度な設定について知りたい場合はお知らせください!ユーティリティネットワークについて質問があれば必ず Esri Community site で質問してください。
ガスや水道システムなど加圧ネットワーク管理にユーティリティネットワークを使う方法についてもっと知りたい場合はぜひ Learn ArcGIS Utility Network for Water Utilities と Learn ArcGIS Utility Network for Gas and Pipeline 学習シリーズをご覧ください。この学習シリーズにはチュートリアルや記事が含まれており、ユーティリティネットワークを使ってこれら業界のニーズに対応する方法が示されています。