- Home
- :
- All Communities
- :
- Products
- :
- ArcGIS Business Analyst
- :
- ArcGIS Business Analyst Ideas
- :
- Create a heat map using my zip code level data
- Subscribe to RSS Feed
- Mark as New
- Mark as Read
- Bookmark
- Follow this Idea
- Printer Friendly Page
Create a heat map using my zip code level data
- Mark as New
- Bookmark
- Subscribe
- Mute
- Subscribe to RSS Feed
- Permalink
Using Business Analyst, I routinely create drive time maps with zip codes boundaries showing demographic data: see below. These maps are very useful for detemining were to build a new program site. As the current ESRI demographic data doesn't always align well with the target population we serve, I would like to be able upload my own excel file with zip code or county data to create custom heat maps. A sample data set is attached.
Llyn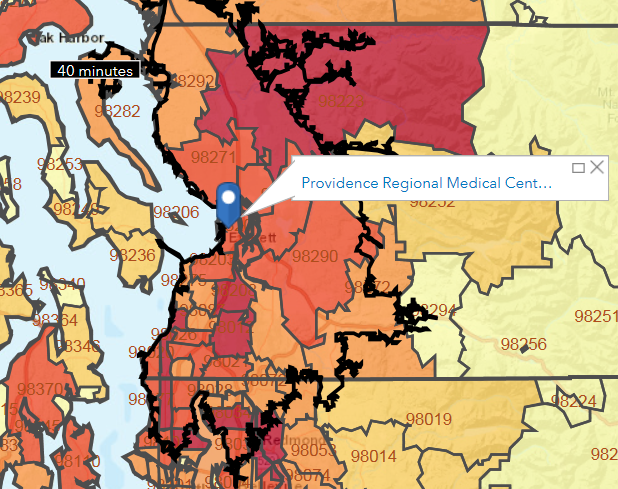
Hello Llyn Kawasaki,
Thank you for sharing this idea! The example you've shared looks like a thematic map, where different ranges are associated with the assorted shades of red. Currently in the Business Analyst Web App, you can bring in data from ArcGIS . Your Excel document can be added through that route and symbolized to your liking, but I can see how the additional steps may be time consuming.
How are you using your ZIP Code data, and what is your general workflow in determining drive times for your projects? Do you focus on the higher groupings (Over 800, 700-799, etc.) or is there more to the process? How will your idea improve your existing workflows?
Thanks,
Scott
Hi Llyn,
I am pleased to inform you that your idea to upload your own excel file with zip code or county data to create custom heat maps is implemented in the current version of Business Analyst Web.
This feature is now available in Custom Data Setup. In the Custom Data Setup workflow, select "Import file" to add your sample file. On Step 2 of Custom Data Setup, select "Geographic boundaries". On Step 3, select ZIP Code as the geographic boundary level and select Zip Code as the geography name or ID column and click Next. Fix any invalid ZIP Code and click Add Matches. The custom data will be imported and you can complete the Custom Data Setup by following the steps and click Save. Once the custom data is setup, you will have options to use the data in Color-coded Maps, Smart Map Search, Suitability Analysis and Reports.

You can find a Step-by-step Custom Data Setup guide in the Business Analyst Help Documentation here - https://doc.arcgis.com/en/business-analyst/web/custom-data-setup.htm
Thank you for using Business Analyst Web App and for your valuable feedback. Please keep these great ideas coming.
Best regards,
Donna
You must be a registered user to add a comment. If you've already registered, sign in. Otherwise, register and sign in.