Subnetwork Scalability Analysis
What is Subnetwork Scalability Analysis?
Before talking about Utility Network subnetwork scalability analysis, let's review the definitions of what is a subnetwork and what is scalability analysis:
A subnetwork:
In a utility network, a subnetwork is a partition or topologic subset of the data in a tier where all participating features have connectivity to the same controllers. A subnetwork is often used for tracing to determine if connectivity is available.
Scalability analysis:
Scalability analysis is for determining a Utility Network deployment's ability to execute multiple requests concurrently (e.g., updateSubnetwork and exportSubnetwork). This is typically done to understand if time-dominant business objectives can be met. For example, can a particular deployment export 5,000 subnetworks within a 4 hour window?
The answer to this question is unknown until tested and verified.
The scalability of a deployment is tied to how much concurrency can take place at once while maintaining optimal performance of the operations of interest. This Article discusses how to apply concurrency via a test (included in Article).
Note: For more information on a subnetwork, see: The Life Cycle of Subnetwork in Utility Network
Our Utility Network Objective and Goal
- Automate the tasks of updating or exporting a list of subnetworks
- Capture performance time
- Overall task
- Individual operations (e.g., time to update a specific subnetwork)
- Solution configurable to meet requirements
- Time sensitive
- Resource sensitive
Why Perform Update/Export Subnetwork Analysis?
- Typical purpose and time constraints are a business requirement
- Exercise two functions per subnetwork
- Update (updateSubnetwork)
- Commonly performed after both editing and validate network topology have been called or enable network topology has been carried out
- Export (exportSubnetwork)
- Used to extract information about the subnetwork to a file which can then be used by external system like outage management
- Before a subnetwork can be exported out of the system, it needs to be up-to-date (updated)
Both are important utility network functions. As a GIS administrator or developer, it is important to understand how these operations scale. Understanding the time to process a list of subnetworks is the primary analysis.
This can be taken further by exploring solutions that optimize the task for time or system resources. These challenges have similar approaches on how to accomplish the task of updating or exporting many subnetworks.
- Gain insight on business objectives
- Exporting Subnetworks can take more compute time depending on the options utilized
- Such options may be a business requirement
- Performance and scalability can affect architecture
- From the test results and findings
- Deployment configuration might need to change to meet business needs
How to Accomplish Subnetwork Scalability Analysis?
List of Subnetworks
The first step is to extract a list of subnetworks from the Utility Network dataset.
This can be done through a variety of methods:
- ArcGIS Pro
- ArcPy script
- SQL select statements
SQL example:
- Connect to the Utility Network geodatabase
- Find the ObjectId for the Subnetwork table:
- This ObjectId is dynamic and can vary
- Type GUID is constant
-- Find Utility Network ObjectId for Subnetwork table
SELECT OBJECTID FROM sde.GDB_ITEMS WHERE type='{37672BD2-B9F3-48C1-89B5-8C43BBBB6D57}'- For our example database, this returned 446
- This ObjectId value will be used in the next query
- Export the list of subnetworks
-- Export list of Subnetworks
SELECT
T1.SUBNETWORKCONTROLLERNAME, T1.SUBNETWORKNAME, T1.ISDIRTY,
T1.ISDELETED, T1.TIERNAME, T1.DOMAINNETWORKNAME, T1.GDB_FROM_DATE
FROM
elec.UN_446_SUBNETWORKS T1
INNER JOIN (SELECT SUBNETWORKNAME, MAX(GDB_FROM_DATE) AS MaxDate
FROM
elec.UN_446_SUBNETWORKS
GROUP BY SUBNETWORKNAME) T2
ON T1.SUBNETWORKNAME = T2.SUBNETWORKNAME
AND T1.GDB_FROM_DATE = T2.MaxDate- Save output to a file (csv or tsv)
- Some SubnetworkControllerNames may contain commas (e.g., ",") and a tab-separate value instead of a comma-separated value file would be more appropriate
For the Utility Network dataset used in this Article, the resulting list of subnetworks looks like the following when the data rows are separated with tabs.
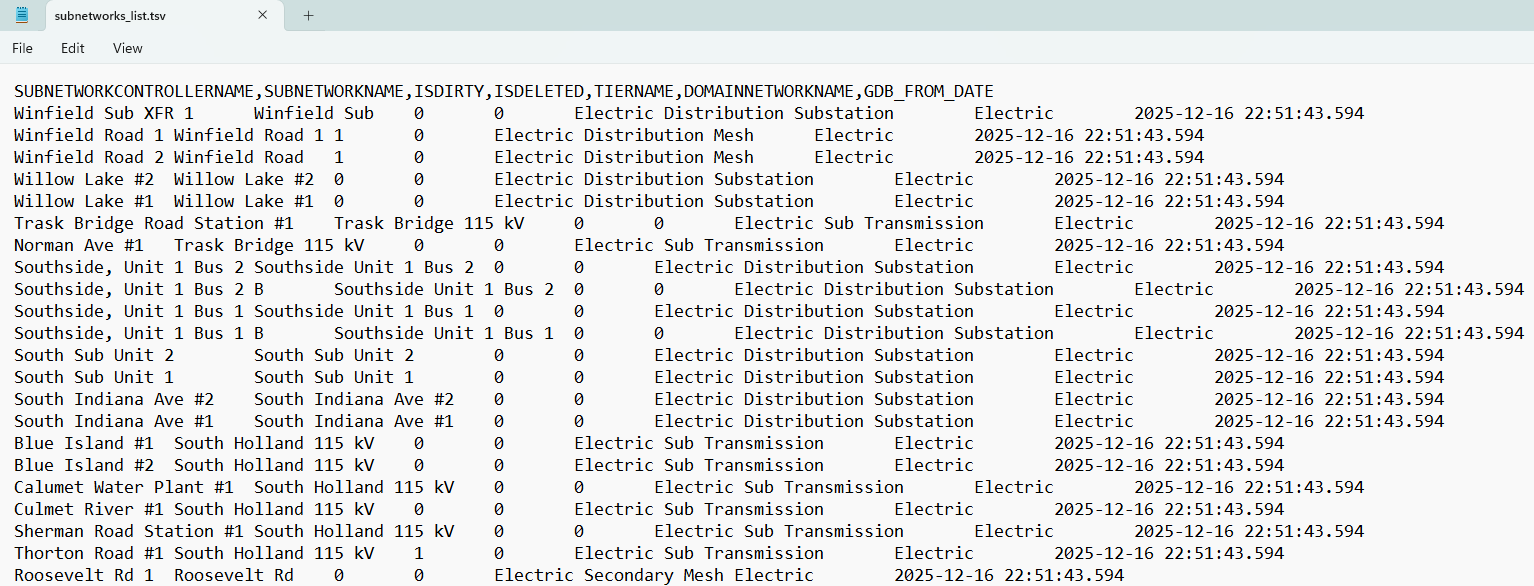
Note: It is assumed current state of the network contains clean and dirty subnetworks. How subnetworks become dirty is beyond the scope of this Article.
Note: There can be several business factors that can go into a selection to pull out subnetworks. This query is to help get you started.
Apache JMeter
As mentioned in other Community Articles, Apache JMeter is free testing tool. It is great for exercising the REST endpoint of ArcGIS Enterprise to test many functions:
While there are many testing tools out there, JMeter will be used to call a Utility Network service in ArcGIS Enterprise for making updateSubnetwork and exportSubnetwork requests.
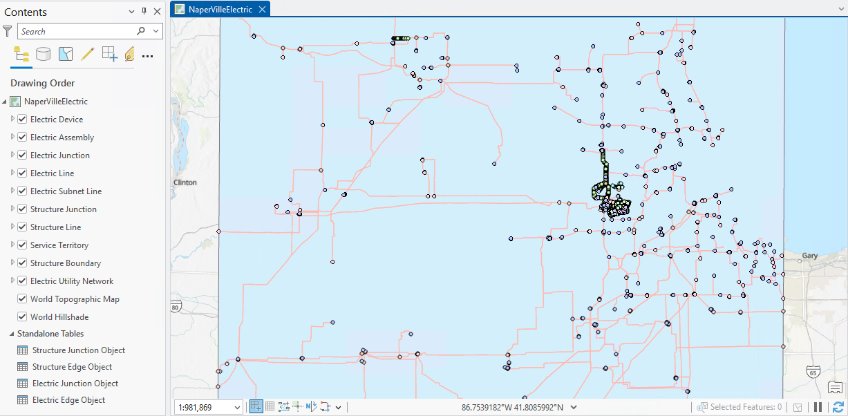
Utility Network Dataset -- Naperville Electric
Naperville Electric data, as seen from ArcGIS Pro:
Update Subnetwork
Apache JMeter – File system view of Test Plan folder
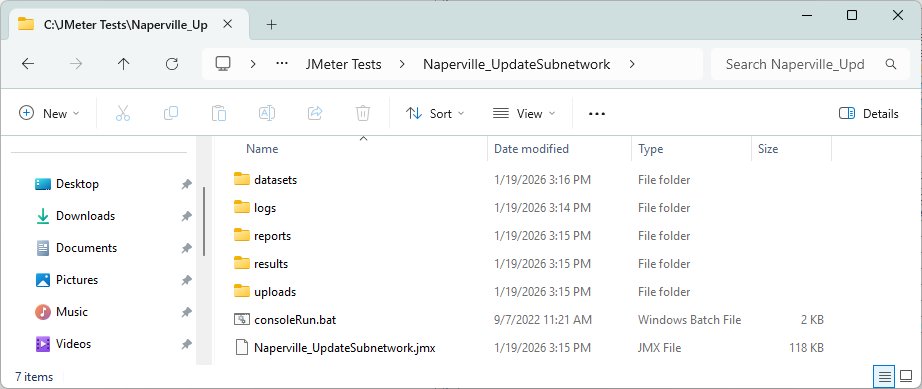
Outside of JMeter the Test Plan is just a jmx file, all by itself. As mentioned in other Community Articles, it is recommended to create some folder structure of the project you work with. This can aid with management, especially if you have many different tests doing different things. In the folders pictured above, the list of subnetworks and test results can be keep inside the UpdateSubnetwork directory where it is less likely to confused with other test run data.
The Update Subnetwork Test Plan
- To download the Apache JMeter Test Plan used in this Article see: UpdateSubnetwork1.zip
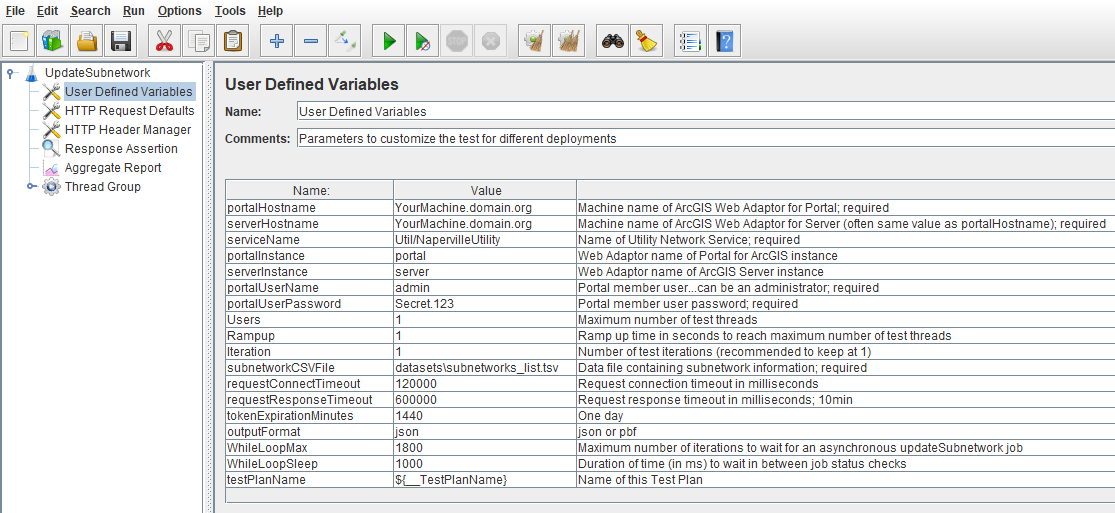
- Opening the Test Plan in Apache JMeter should look similar to the following:
- Adjust the User Defined Variables to fit your environment
Key Components of the Test Plan
With the UpdateSubnetwork Test Plan expanded, the following elements can been seen:
- User Defined Variables
- List above, used to easily tailor the test to an environment
- Aggregate Report
- Used for debugging test and post-test analysis
- Thread Group
- Defines the thread concurrency or scalability of the test
- Recommended to use default values (e.g., 1 test thread) while building a test
- GenerateToken
- Obtains an token from ArcGIS Enterprise
- Uses credentials defined earlier
- Holds onto it during test
- While Controller Sync
- Used when business logic dictates calls should be synchronous
- Loops over list of subnetworks
- CSV Data Set Config
- Links list of subnetworks to test
- CSV or TSV data text file
- If Controller
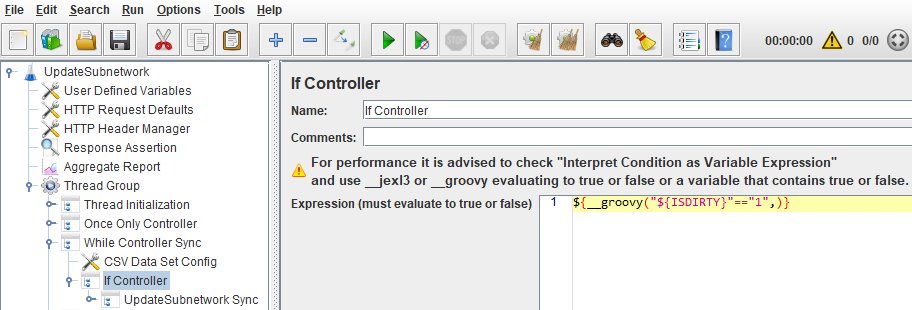
- A logic branch of the test using Groovy
- Follows branch if subnetwork is dirty (IsDirty=True or IsDirty=1)
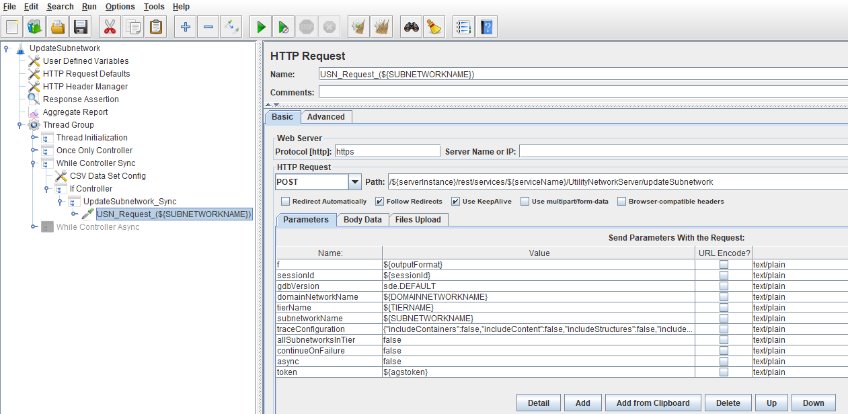
- USN Request (${SUBNETWORKNAME})
- The test element that issues the request to perform bulk of work
- From the data file source, ${SUBNETWORKNAME} is populated with the name of the subnetwork
- While Controller Async
- Used when business logic dictates calls should be asynchronous
- Ideal for very long running updateSubnetwork requests
- Loops over list of subnetworks
- To utilize:
- Right-click on While Controller Async and select Enable
- Right-click on While Controller Sync and select Disable
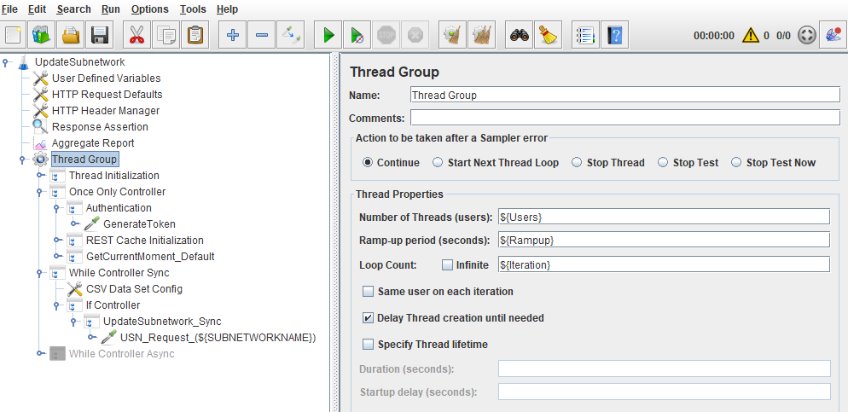
Note: Set the Thread Group values to determine the scalability profile of the Update Subnetwork test. A larger value for "Users" means a higher maximum concurrency that test will reach. Increase "Rampup" to gradually increase the amount of concurrency across that duration of time (in seconds).
A Closer Look at GenerateToken
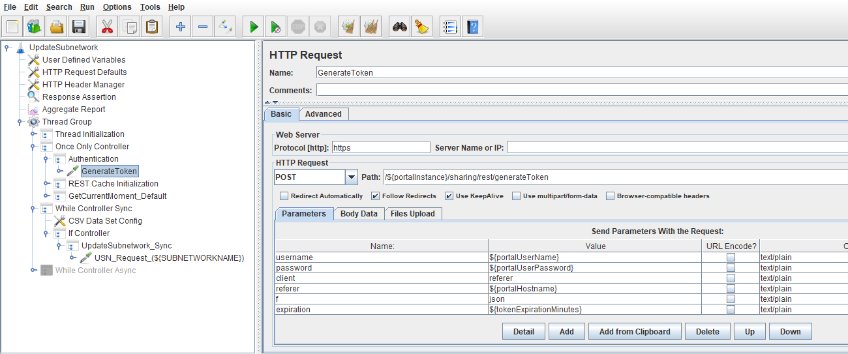
The GenerateToken request is an important part of the test. It occurs early in the test and the Utility Network service will most likely require authentication.
The Generate Token Request
Capturing the Token
Requesting the token is half the work. The other part is capturing it and storing it as a variable so JMeter can access while the test runs. This is done with the Regular Expression Extractor element from JMeter.
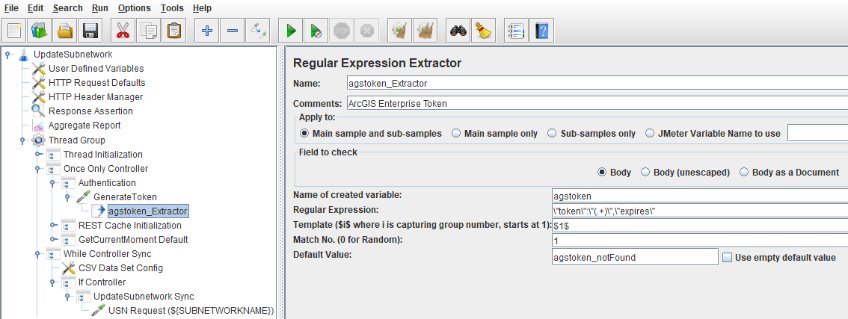
Note: How regular expressions work is beyond the scope of this Article, but it essentially looks for particular string signature in the response and if found, puts it into a JMeter variable called agstoken.
Update Subnetwork Test Plan Data File -- The List of Subnetworks
The CSV Data Set Config element plays a huge role as it ties our subnetwork data list to the test.
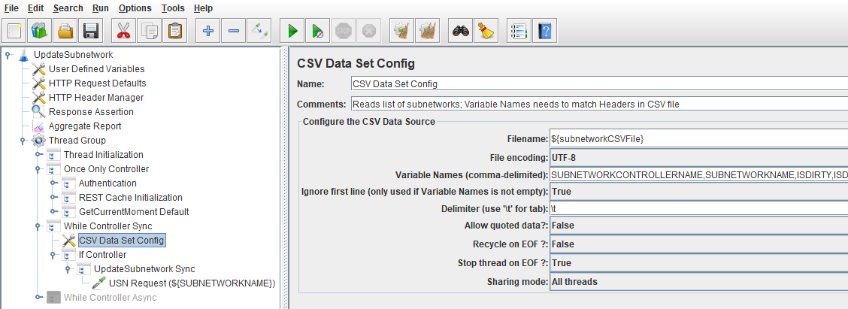
Note: Some Utility Network datasets may contain the comma character (e.g., ",") in the SubnetworkControllerName. Where this occurs, it is advantageous to save the list of subnetworks as tab separated values instead of a comma separated values.
Note: In cases where a tab separated values file is used, JMeter will still expect the header line in the list of subnetworks to be comma separated.
If Controller Logic
For convenience, test logic was added to only update subnetworks from the list if the IsDirty field equals 1.
Groovy is used to accomplish this task in the test.
Apache Groovy is a scripting language based on Java that provides powerful functions and programmatic support for things that might be difficult for the standard JMeter test elements.
The Update Subnetwork HTTP Request
This test element in the Test Plan is the responsible for updateSubnetwork web calls in the test.
This component issues the request and JMeter evaluates the response coming back from ArcGIS Enterprise through the REST endpoint.
Test Execution
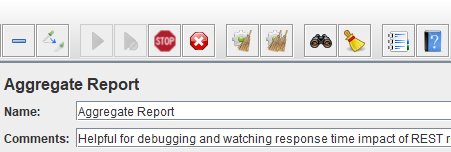
Graphic User Interface (GUI) execution
- Ideal for test authoring and debugging
- Play and Stop buttons

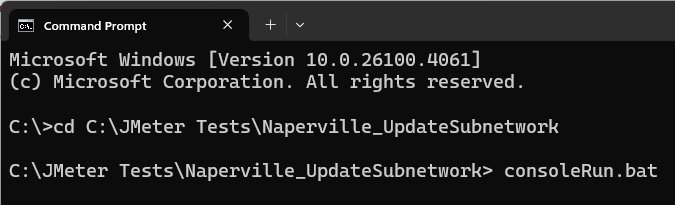
Command-line execution
- Great for official test runs
- More efficient memory utilization
- Especially if listeners like the Aggregate Report are disabled for the run
- Play (consoleRun.bat) and Stop (Control-C)
- When the test is run via the consoleRun.bat, a results.jtl file will be generated in the results folder
- This is the "results file" and contains valuable performance information on operations from the test
Note: It is always recommended to coordinate the load test start time and duration with the appropriate personnel of your organization. This ensures minimal impact to users and other colleagues that may also need to use your on-premise ArcGIS Enterprise Site. Additionally, this helps prevent system noise from other activity and use which may "pollute" the test results.
Note: For several reasons, it is strongly advised to never load test services provided by ArcGIS Online.
Analysis -- Reporting and Evaluation
Aggregate Report Element (Test Debugging)
From this analysis, we can easily see the UpdateSubnetwork_Sync transaction and some key statistics that tells us important performance information about the operation overall.
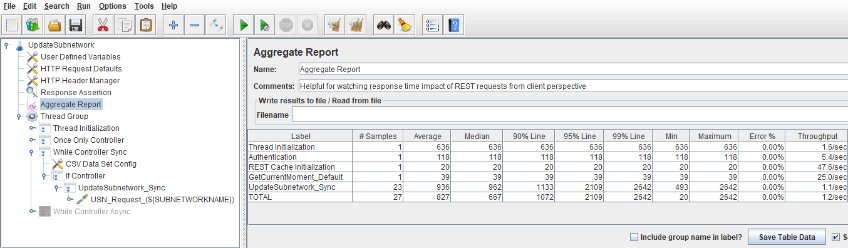
For a rough total time estimate, when using 1 test thread of concurrency, just multiply the number of samples times the average. For example: "# Samples * Average" = Total Test Run Time (ms)
For "official" test runs, it is recommended to disable the Aggregate Report listener from the Tree (a simple right-click then select Disable) and only use it for test authoring, debugging and post-test processing.
Note: For post-test processing, the Aggregate Report can still be used to browse, select and load a test results file even if it is disabled in the GUI.
The Results File
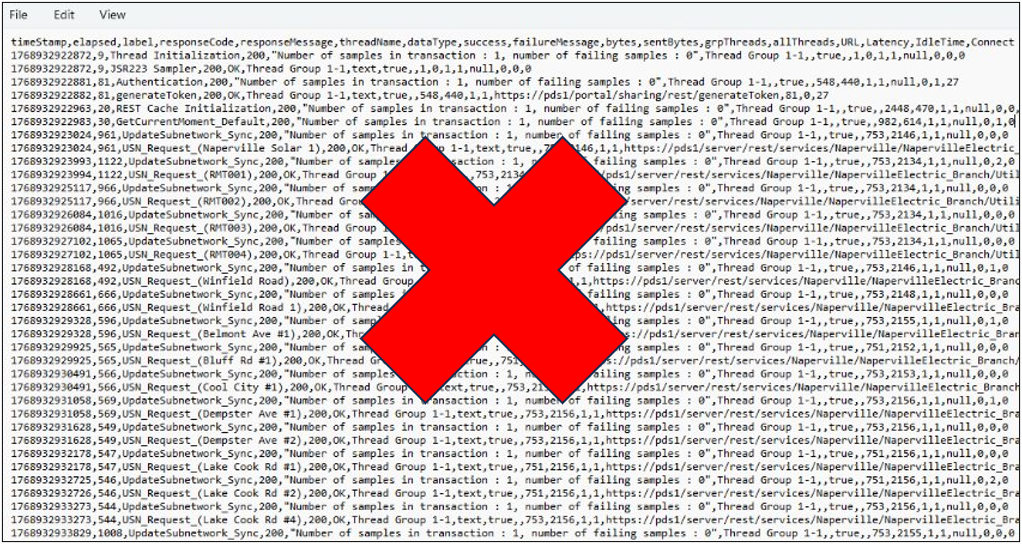
When run from the command-line script, a JMeter will produce a results file as part of its output. The results file (*.jtl file), contains raw request information in text form.
The contents in this file contains a listing all the subnetworks and their individual response times. While easy to open and view with any common editor, performing analysis in this form is not recommended.
Aggregate Report Element (Post-Test Analysis)
Let us circle back to the Aggregate Report element for some post-test analysis. From the JMeter GUI, click the Browse button to find the jtl results file then select Open to load it.
Once loaded, the jtl file is processed by JMeter and a statistical report is generated is the Aggregate Report section.
The Aggregate Report element is interactive, so you can click on the Maximum header field to easily re-sort the listing and find subnetworks that were taking the most time. The UpdateSubnetwork_Sync transaction is still listed, which is critical for understanding if the overall numbers are meeting certain performance requirements from a service level agreement (SLA).
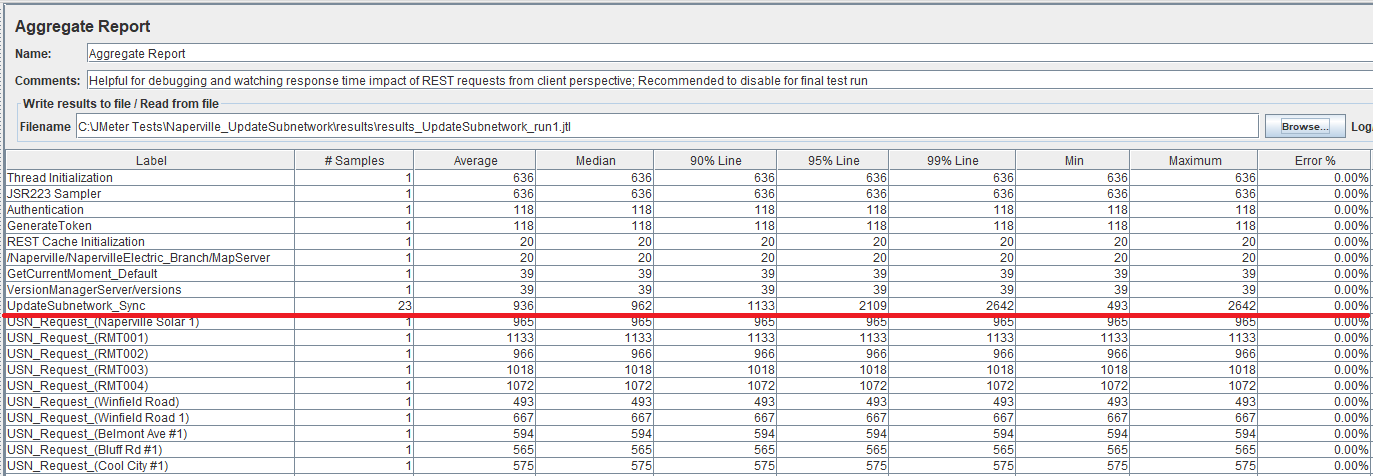
Note: The number of subnetworks in this dataset is small. Test results from production datasets would have more samples.
Taking the Analysis Further
Since the results file is comma separated values, it can easily be opened in a spreadsheet.
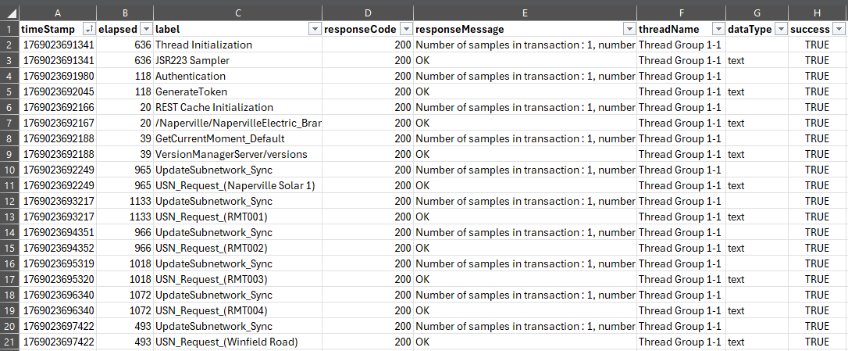
A view of the result data with some minimal formatting.
This is good but can it be better?
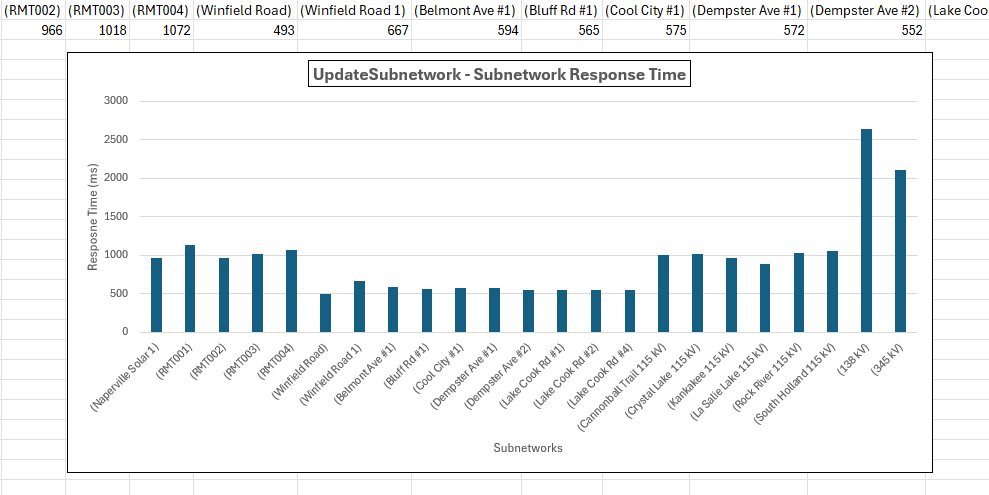
Charting the transaction performance offers improved clarity.
Note: If you are just after overall numbers, filter out individual subnetwork requests (e.g., the field where responseMessage = OK).
Export Subnetwork
Apache JMeter – File system view of Test Plan folder
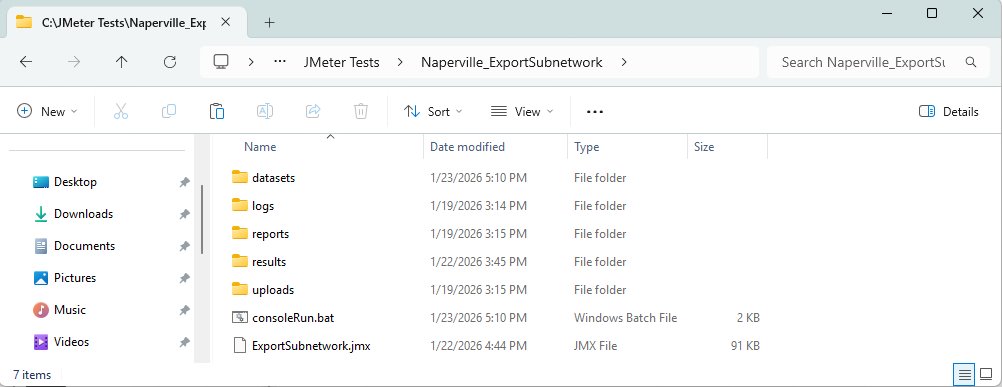
The Export Subnetwork Test Plan
- To download the Apache JMeter Test Plan used in this Article see: ExportSubnetwork1.zip
- Opening the Test Plan in Apache JMeter should look similar to the following:
- Adjust the User Defined Variables to fit your environment
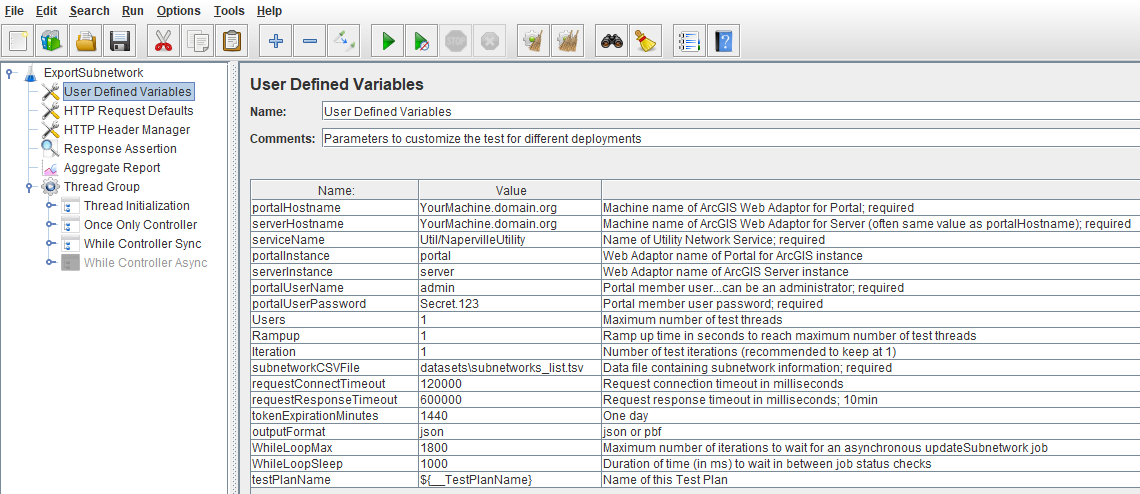
Note: Set the Thread Group values to determine the scalability profile of the Export Subnetwork test. A larger value for "Users" means a higher maximum concurrency that test will reach. Increase "Rampup" to gradually increase the amount of concurrency across that duration of time (in seconds) until the maximum is met.
The Export Subnetwork HTTP Request
This test element in the Test Plan is the responsible for exportSubnetwork web calls in the test.
This component issues the request and JMeter evaluates the response coming back from ArcGIS Enterprise through the REST endpoint.
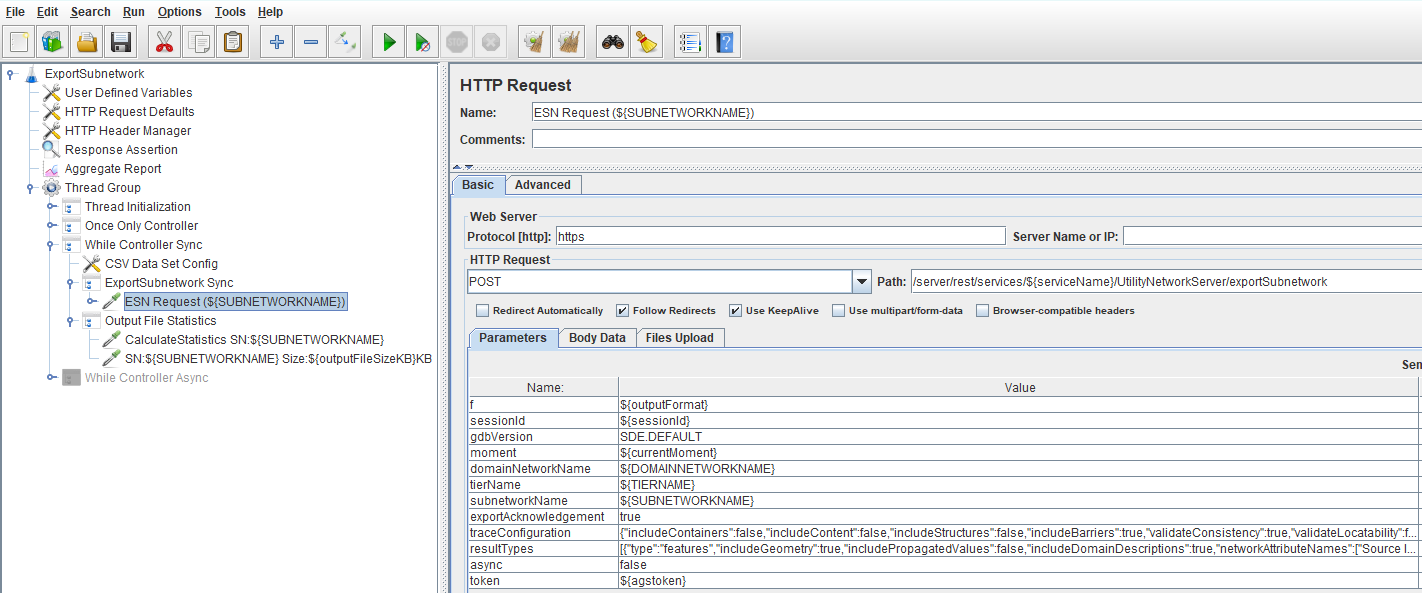
Note: This Export Subnetwork Test Plan is designed to export every subnetwork in the data file.
Advanced JMeter
Getting the Size of the Export Subnetwork Output
The exportSubnetwork request produces a file on ArcGIS Server. This output file (which is commonly formatted as json or pbf) can then be imported into other systems. The size on disk of this item can vary but is helpful test metadata to capture.
While having the Request element directly read the output to obtain the size might be simple, it would be very inefficient. However, this task is an opportunity to utilize the Groovy language mentioned earlier and perform some heavier file system computation quickly.
After the exportSubnetwork request, there are additional requests in the form of two JSR223 Samplers:
- CalculateStatistics SN:${SUBNETWORKNAME}
- SN:${SUBNETWORKNAME} Size:${outputFileSizeKB}KB
The first Sample contains Groovy logic to read the output file from the export and put it into a JMeter variable.
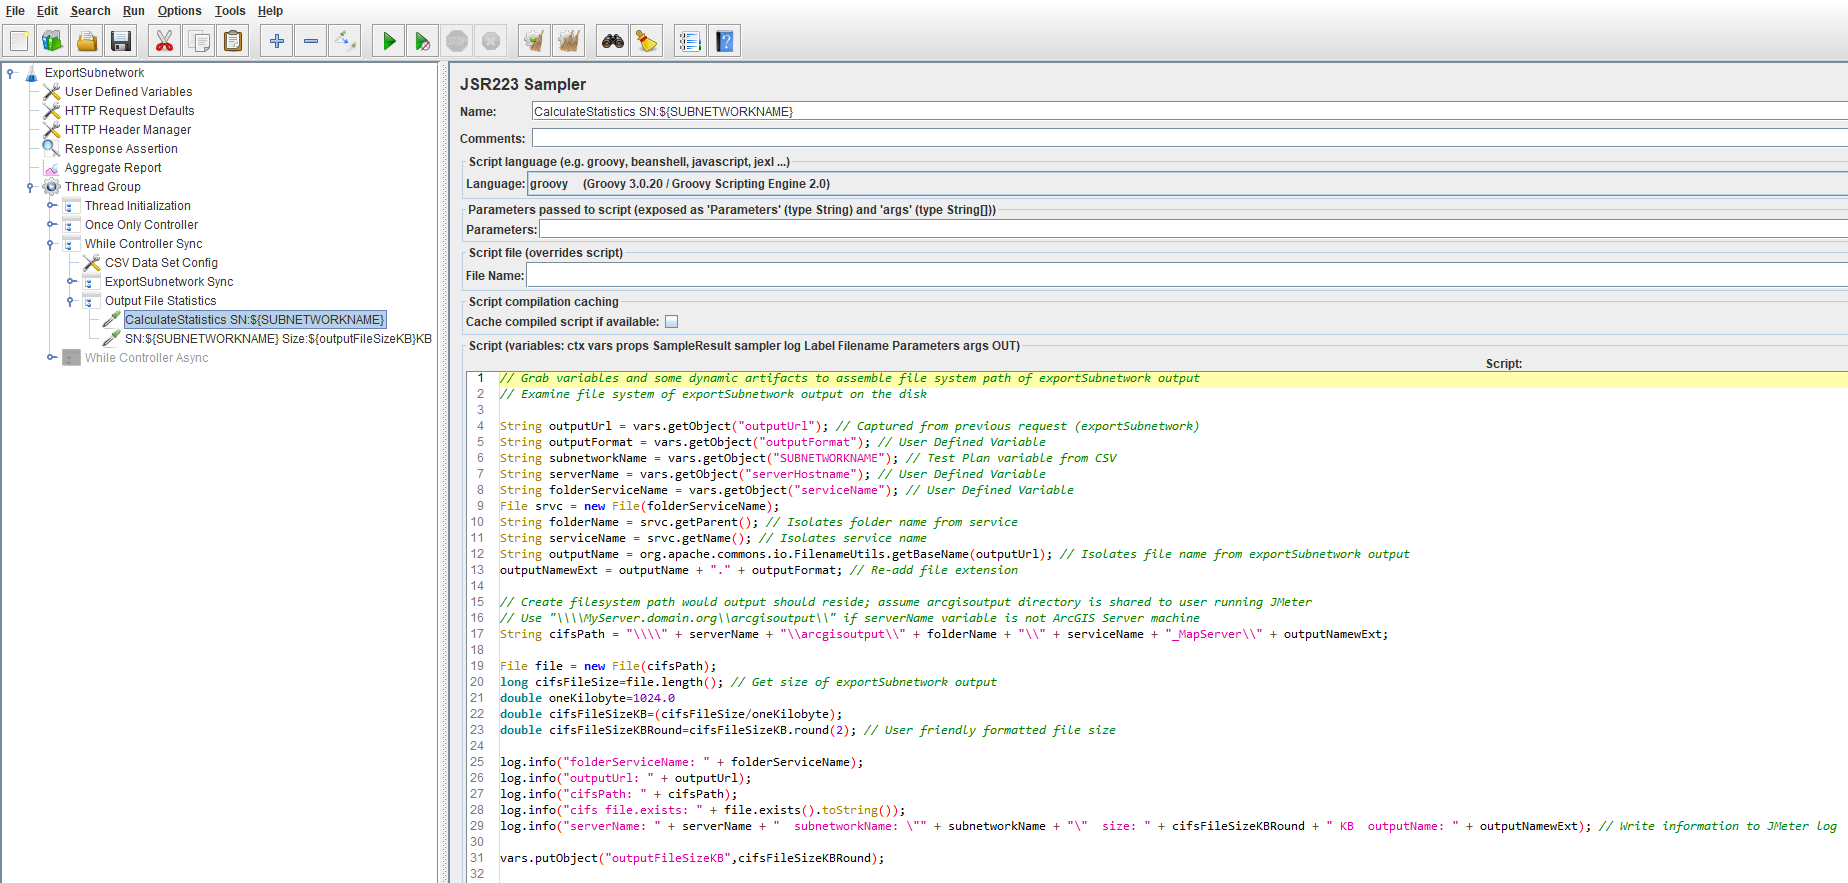
A closer look at the Groovy logic:
// Grab variables and some dynamic artifacts to assemble file system path of exportSubnetwork output
// Examine file system of exportSubnetwork output on the disk

String outputUrl = vars.getObject("outputUrl"); // Captured from previous request (exportSubnetwork)
String outputFormat = vars.getObject("outputFormat"); // User Defined Variable
String subnetworkName = vars.getObject("SUBNETWORKNAME"); // Test Plan variable from CSV
String serverName = vars.getObject("serverHostname"); // User Defined Variable
String folderServiceName = vars.getObject("serviceName"); // User Defined Variable
File srvc = new File(folderServiceName);
String folderName = srvc.getParent(); // Isolates folder name from service
String serviceName = srvc.getName(); // Isolates service name
String outputName = org.apache.commons.io.FilenameUtils.getBaseName(outputUrl); // Isolates file name from exportSubnetwork output
outputNamewExt = outputName + "." + outputFormat; // Re-add file extension

// Create filesystem path would output should reside; assume arcgisoutput directory is shared to user running JMeter
// Use "\\\\MyServer.domain.org\\arcgisoutput\\" if serverName variable is not ArcGIS Server machine
String cifsPath = "\\\\" + serverName + "\\arcgisoutput\\" + folderName + "\\" + serviceName + "_MapServer\\" + outputNamewExt;

File file = new File(cifsPath);
long cifsFileSize=file.length(); // Get size of exportSubnetwork output
double oneKilobyte=1024.0
double cifsFileSizeKB=(cifsFileSize/oneKilobyte);
double cifsFileSizeKBRound=cifsFileSizeKB.round(2); // User friendly formatted file size

log.info("folderServiceName: " + folderServiceName);
log.info("outputUrl: " + outputUrl);
log.info("cifsPath: " + cifsPath);
log.info("cifs file.exists: " + file.exists().toString());
log.info("serverName: " + serverName + "  subnetworkName: \"" + subnetworkName + "\"  size: " + cifsFileSizeKBRound + " KB  outputName: " + outputNamewExt); // Write information to JMeter log

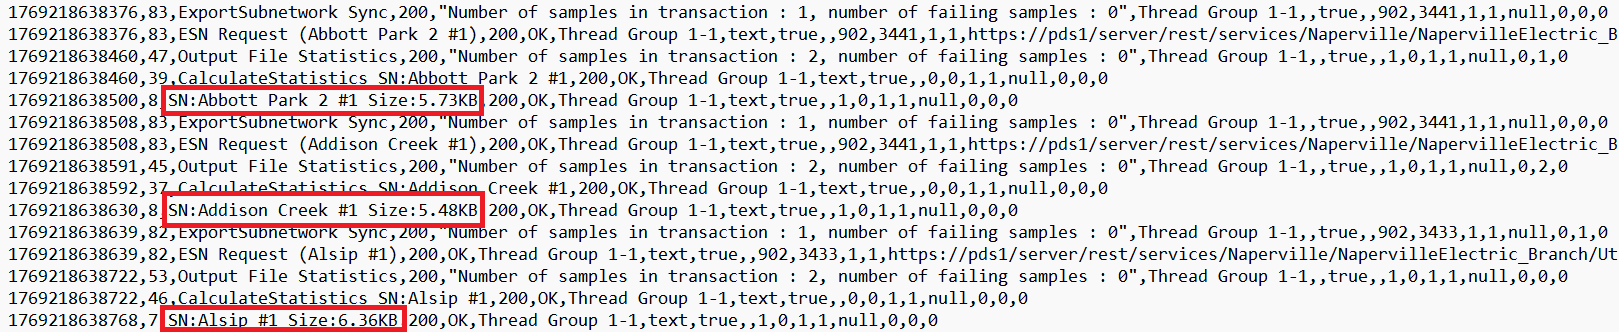
vars.putObject("outputFileSizeKB",cifsFileSizeKBRound);The second Sample simply lists the captured file size in the Name property of the JSR223 Sampler element in the test. This value is then reported as the name of the request in the jtl results file which could be used for further analysis.
For example:
Getting Individual Subnetwork Response Time from an Asynchronous Job
The Asynchronous Execution Style
The default execution style in the test is synchronous. It is simple and straight-forward. Issue the request and just wait for the response. This is the ideal approach when the response time per request is expected to be less than 10 minutes.
For requests that run longer than 10 minutes, asynchronous is the recommended approach. However, there are more moving parts with an asynchronous test:
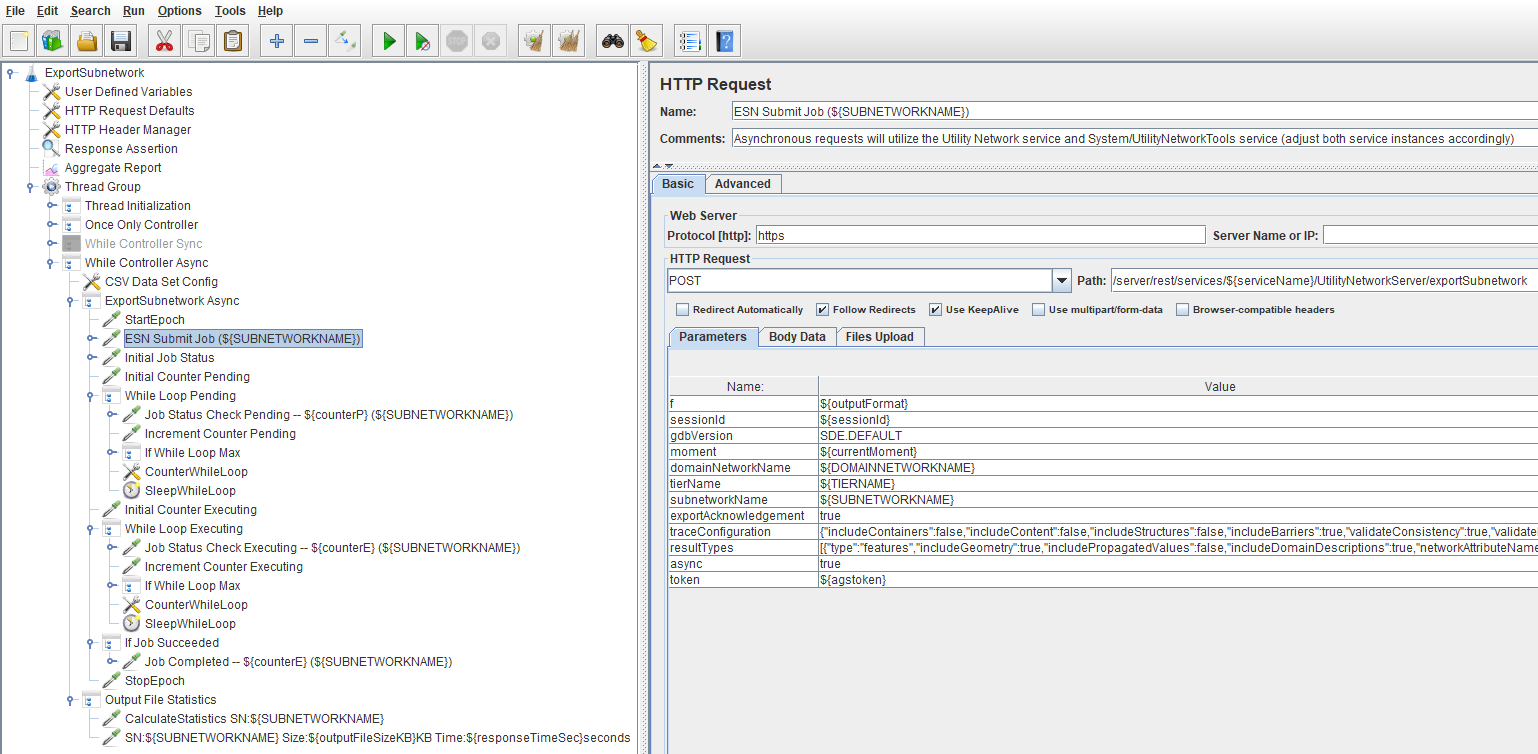
- A job is submitted
- The job status is periodically polled in a loop
- There are more than one loop
- Once complete the output location for that job can then be captured
Each of these steps is its own request in the test, and each has a response time which is captured in the results file. While JMeter reports this total time under the transaction name of ExportSubnetwork Async (this is great because it provides handy overall statistics on the function) it does not easily link each individual subnetwork to its respective response time.
Groovy to the Rescue (Again)
Calculating a single response time for each subnetwork operation can be accomplished in Groovy by setting a timer at the beginning and end of the asynchronous loop. Groovy simply calculates the difference and reports the time back into the test (like the size calculation).
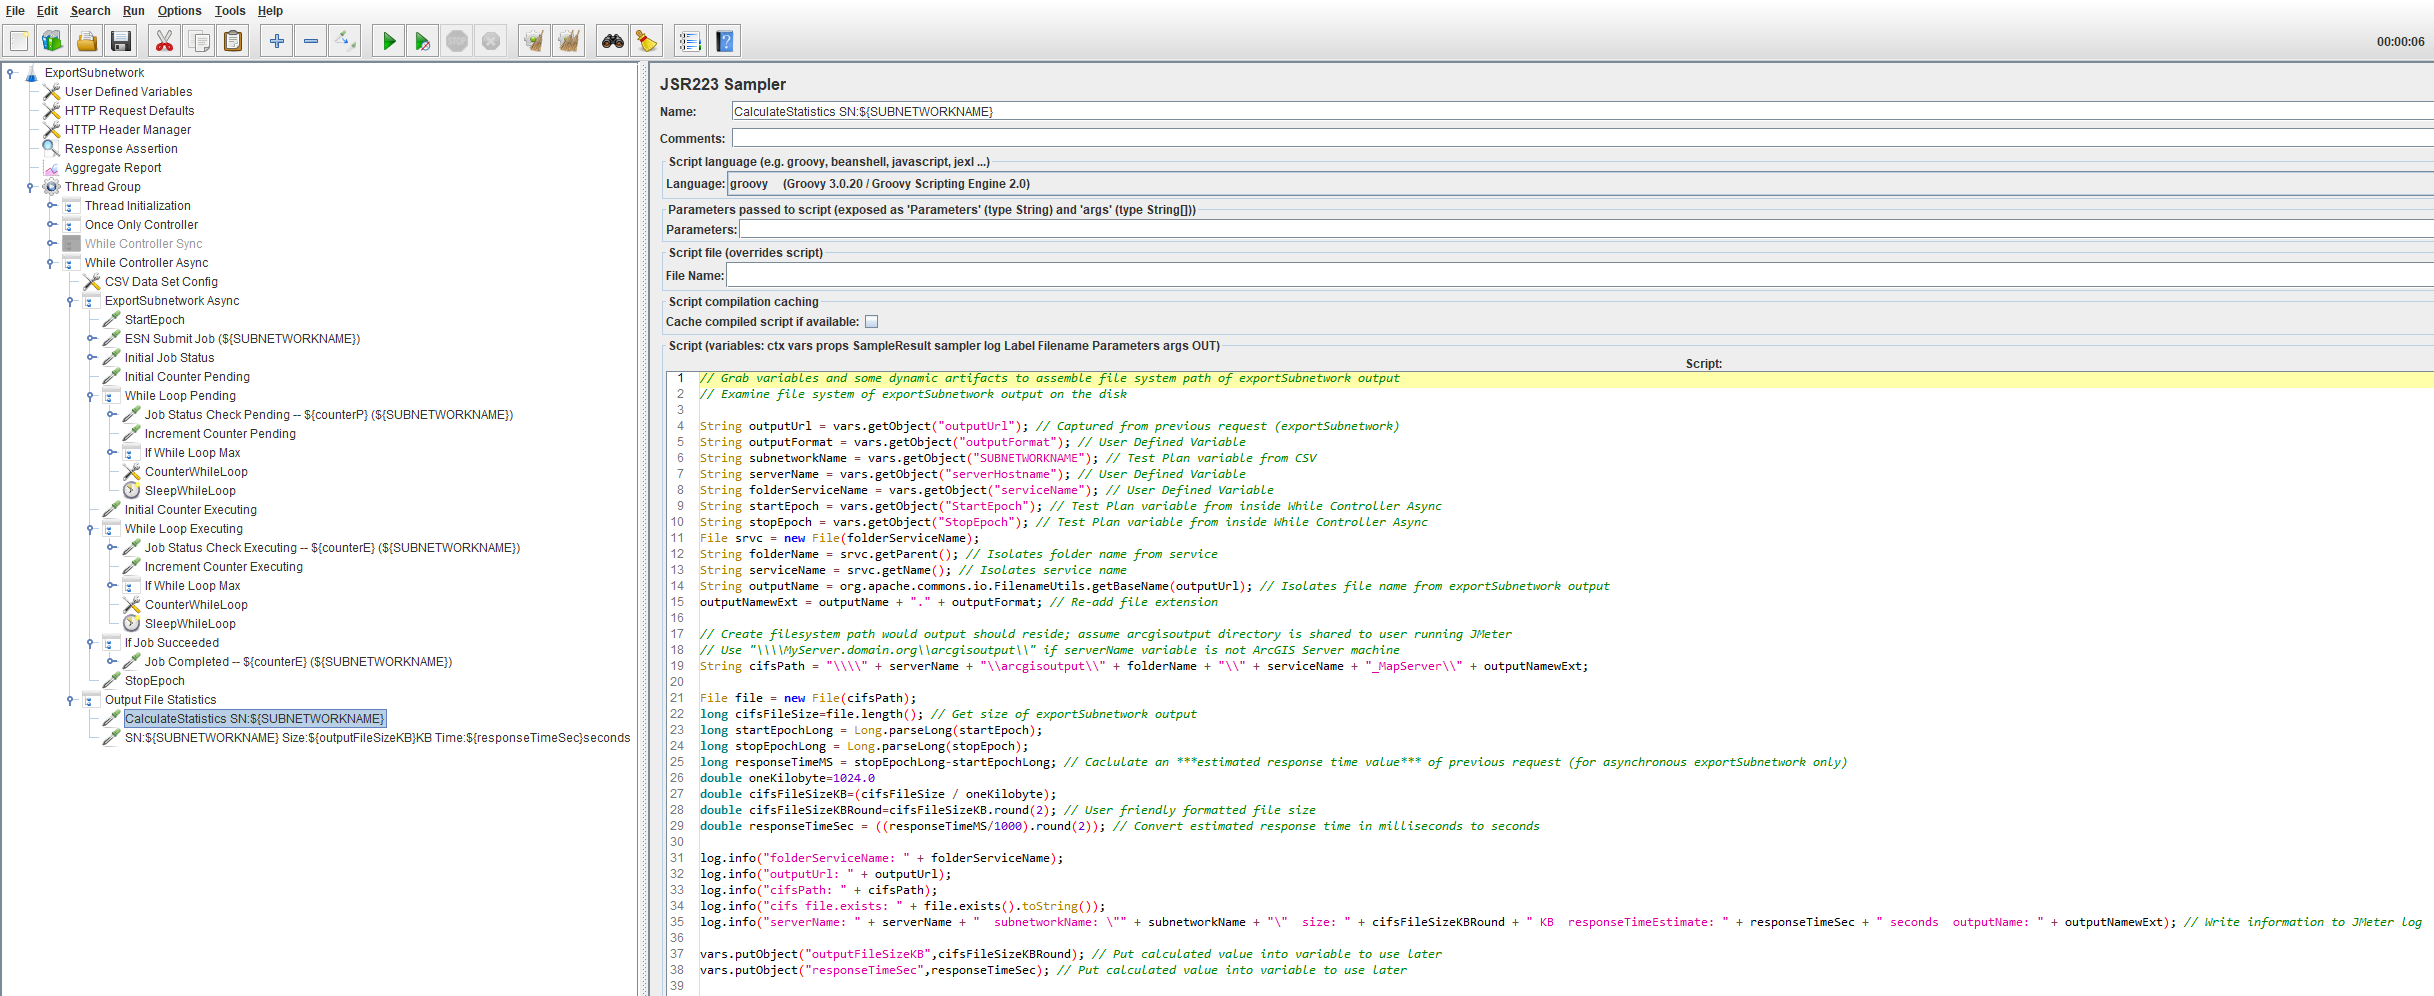
A closer look at the Groovy logic:
// Grab variables and some dynamic artifacts to assemble file system path of exportSubnetwork output
// Examine file system of exportSubnetwork output on the disk

String outputUrl = vars.getObject("outputUrl"); // Captured from previous request (exportSubnetwork)
String outputFormat = vars.getObject("outputFormat"); // User Defined Variable
String subnetworkName = vars.getObject("SUBNETWORKNAME"); // Test Plan variable from CSV
String serverName = vars.getObject("serverHostname"); // User Defined Variable
String folderServiceName = vars.getObject("serviceName"); // User Defined Variable
String startEpoch = vars.getObject("StartEpoch"); // Test Plan variable from inside While Controller Async
String stopEpoch = vars.getObject("StopEpoch"); // Test Plan variable from inside While Controller Async
File srvc = new File(folderServiceName);
String folderName = srvc.getParent(); // Isolates folder name from service
String serviceName = srvc.getName(); // Isolates service name
String outputName = org.apache.commons.io.FilenameUtils.getBaseName(outputUrl); // Isolates file name from exportSubnetwork output
outputNamewExt = outputName + "." + outputFormat; // Re-add file extension

// Create filesystem path would output should reside; assume arcgisoutput directory is shared to user running JMeter
// Use "\\\\MyServer.domain.org\\arcgisoutput\\" if serverName variable is not ArcGIS Server machine
String cifsPath = "\\\\" + serverName + "\\arcgisoutput\\" + folderName + "\\" + serviceName + "_MapServer\\" + outputNamewExt;

File file = new File(cifsPath);
long cifsFileSize=file.length(); // Get size of exportSubnetwork output
long startEpochLong = Long.parseLong(startEpoch);
long stopEpochLong = Long.parseLong(stopEpoch);
long responseTimeMS = stopEpochLong-startEpochLong; // Caclulate an ***estimated response time value*** of previous request (for asynchronous exportSubnetwork only)
double oneKilobyte=1024.0
double cifsFileSizeKB=(cifsFileSize / oneKilobyte);
double cifsFileSizeKBRound=cifsFileSizeKB.round(2); // User friendly formatted file size
double responseTimeSec = ((responseTimeMS/1000).round(2)); // Convert estimated response time in milliseconds to seconds

log.info("folderServiceName: " + folderServiceName);
log.info("outputUrl: " + outputUrl);
log.info("cifsPath: " + cifsPath);
log.info("cifs file.exists: " + file.exists().toString());
log.info("serverName: " + serverName + "  subnetworkName: \"" + subnetworkName + "\"  size: " + cifsFileSizeKBRound + " KB  responseTimeEstimate: " + responseTimeSec + " seconds  outputName: " + outputNamewExt); // Write information to JMeter log

vars.putObject("outputFileSizeKB",cifsFileSizeKBRound); // Put calculated value into variable to use later
vars.putObject("responseTimeSec",responseTimeSec); // Put calculated value into variable to use laterAdditional Strategies
Time vs Resources
- Time constraint example
- Need to complete task within a certain duration (e.g., export 5,000 subnetworks in 4 hours)
- Client (JMeter) and server (ArcGIS Server) can work together for exercising deployment scalability
- Client sends more concurrent test requests, server responds accordingly
- The end result of the overall test run time is the scalability analysis
- From Thread Group element, increase number of Threads and Ramp-up period
- Considerations
- Resource intensive on CPU as more services instances are used
- Servers as well as test client machine
- This higher rate of concurrency could impact other users
- Coordinate and schedule accordingly
- Resource constraint example
- Current setup
- Recommended for initial test authoring and debugging
- Longer overall compute time
- Most forgiving on resources
- Fewer test threads of concurrent execution
- Requires less services instances on Server
- Saves memory resources
Final Thoughts
The Apache JMeter Test Plans in this Article represent a programmatic approach for applying load to a Utility Network service through the updateSubnetwork and exportSubnetwork functions.
Understanding how the system responds to this load through response time numbers returned by ArcGIS Enterprise can help determine if the deployment will be able to meet your performance needs.
The authored tests can be adjusted to meet time (more concurrency, higher scalability required) or resources challenges (memory constrained systems).
Strategies for analyzing the test results were also discussed which included using the Aggregate Report in the JMeter Test Plan for some quick performance statistics as well as charting individual response times for visual clarity.
While the overall process for the Update Subnetwork and Export Subnetwork Test Plans are similar. Export Subnetwork contained an addition Transaction which examined the resulting output on ArcGIS Server using Groovy to obtain the file size for each subnetwork.
- To download the Apache JMeter Test Plans used in this Article see:
Things to Consider
This list contains particular topics that can enhance the overall scalability analysis or topics that could pose as potential challenges:
- Metrics
- Capturing processor and memory utilization of the machines involved in the test can strength the analysis and help detect hardware contention
- Additional analysis
- Optimal service instances
- Utility Network services require dedicated service instances
- Dedicated services have a minimum and maximum number of instances that can be adjusted to meet your needs (concurrent user demand or memory constraints)
- Testing can help find the best configuration to fit your business needs
- Service Level Agreement (SLA)
- Statistics from Aggregate Report can help GIS administrators and/or developers understand if the performance from operations are meeting their needs
- Common pitfalls
- The test client machine
- Test client software can be a resource intensive application
- This is amplified when many concurrent test threads are used in the test
- Consider installing the test client:
- On its own machine (separate from machines performing other ArcGIS duties)
- With adequate hardware resources (number of processing cores and memory)
- Too much pressure, too quickly
- Applying too many concurrent threads to a test too quickly can negatively impact performance
- From the User Defined Variables, adjust the Users and Rampup values in small increments until a configuration is found that works best
- Synchronous vs Asynchronous Test Execution
- Both JMeter Test Plans listed in this Article include the ability to execute the updateSubnetwork or exportSubnetwork requests synchronously or asynchronously
- If it is unknown which execution style to use, it is recommended to use synchronous (Sync), which in the tests, is active and enabled by default
- Synchronous is simpler and the optimal choice for requests that are expected to be completed in under 10 minutes
- Asynchronous (from the point of view of the Test Plan) contains more moving parts, but is ideal for very long running tasks
