Posting this here for additional visibility, it's also in the Coronavirus community.
Hi all!
My name is Benjamin Mittler and I am a GIS Manager working in the University of South Florida Libraries - Digital Heritage and Humanities Collections. Last week I was asked by Canserina Kurnia to create a blog post describing the process I used to create my Florida COVID-19 Time Series Application (which is also found on my Florida COVID-19 Hub). Below is the process I used, I hope some of you find it useful. Let me know if it seems like I left something out.
Creating a Time-Series Map of the COVID-19 Outbreak
I’m going start off this blog with the bad news, this isn’t going to be as easy as plugging Johns Hopkins or your state health department data into an application and pressing go. As you may have noticed by now, most COVID-19 feature services are providing data on current metrics and not including any archival information. This makes creating a time-series a lot more difficult, but still possible. Below are the steps I took in creating my time-series application.
Formatting Spreadsheet
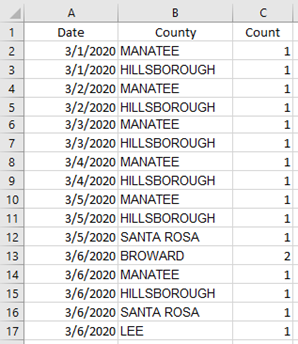
Even though State health departments aren’t publishing archival data as a feature service, they are likely still publishing daily reports. If you are lucky these reports will be in spreadsheet format. I started out by creating a brand new excel spreadsheet with 3 columns; “Date”, “County”, and “Count” (count field represents total cases up to the listed date). I then went through each archival report, day by day, and copy/pasted information into my spreadsheet so that it looked like the below. You only need to include a county in the spreadsheet once it has its first case, no reason to include them if the case count is 0. Notice how for 3/1/2020 only Hillsborough and Manatee are listed, they are the only 2 counties with a case. Once a county appears in the spreadsheet it must appear for all subsequent days.
Excel to table
Using the “Excel to Table” tool in ArcPro, converted the excel table and place it in a geodatabase. At this point you need to find a polygon county layer for the state you are working in. Ensure that the county names match those used in your spreadsheet, and put a copy of this county layer in that same geodatabase. Add both the table and the counties layer to a map.
Make Query Table
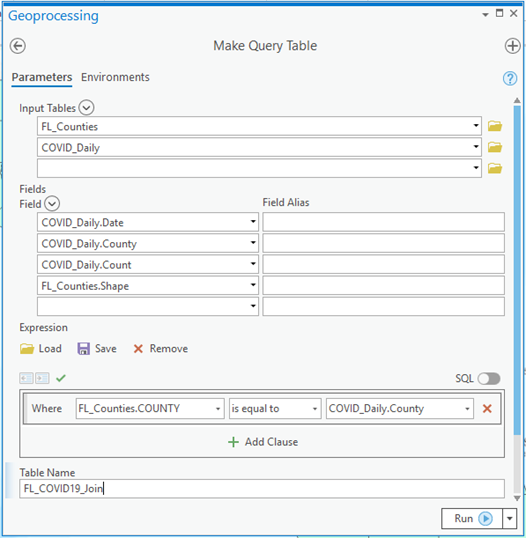
Now it’s time to use my favorite tool “Make Query Table” (not kidding). This tool is going to perform a one-to-many join between your counties layer and the table, the output will be a temporary layer where each row in the table has now been assigned the geometry for its respective county. Start by opening the tool and setting the Input tables to your table and the counties layer. For fields select the Date, County, and Count field from the table and the .shape field from the counties layer. By including the .shape field you are telling the tool that you want the output to have a polygon geometry. Without including the .shape field your output would be a table. Add an expression where the county field from the table is equal to the county field from the polygon layer (you will need to switch the second dropdown from value to field). Set your output table name. EDIT: After some testing I have found that joining to a point county layer rather than polygon increases performance of the time-series app.
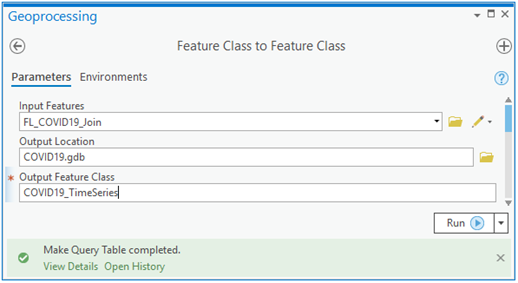
When the tool is finished running, immediately export the output to a new feature layer
Publishing the Layer
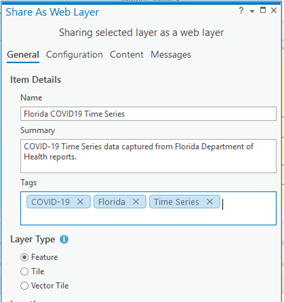
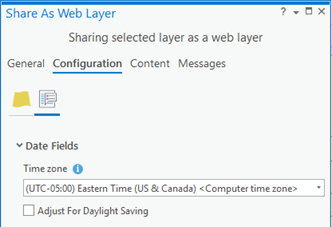
Right click the output from the previous step in your table of contents and select “Sharing” - > “Share as Web Layer”. Fill out the appropriate name, summary, and tags.
Next select “Configuration” and click the button for “Configuration Parameters”. Set the time zone settings to the appropriate time zone. This step is very important and can throw your entire dataset off if not done correctly. When you upload data to ArcGIS Online it will be assumed that your data is in the UTC timezone. When date-time is displayed in ArcGIS Online it is displayed in the viewers time-zone preferences. For instance, if you are in the Eastern Timezone and upload data to ArcGIS Online without setting the appropriate timezone, it will be displayed 5 hour earlier than what is designated in the attribute table. Since I didn’t specify time in my attribute table, this would like push my dates back to the previous day, very bad. Once the time zone is set you can go ahead and publish.
Enabling Time
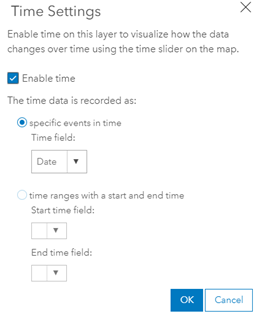
Once the layer is finished publishing, click on the hosted feature layer within your table of contents in ArcGIS Online. Under layers select “Time Settings”. Choose to enable time setting and set the correct time field, click ok.
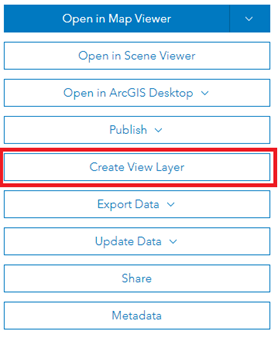
Create a View Layer
This next part is up to you but this is how I chose to set up my data. Because the COVID-19 pandemic is still ongoing the time series is going to have regular updates. In order to best accommodate this I chose to make this hosted feature layer editable but kept its share setting to private. I then created a view layer which is used in my public facing applications.
At this point your layer should be ready to go. You can open it up in a map and set the time setting as you see fit. More information on this can be found here: https://doc.arcgis.com/en/arcgis-online/create-maps/configure-time.htm. Personally, I chose to display my times series through a web app.
Maintaining the time series layer
As previously mentioned, the COVID-19 pandemic is still ongoing so your dataset will likely need to be updated on a daily basis. Luckily, this should be much easier than the process described above. Since state health departments are publishing daily case data, this can be used to update your time-series dataset. In ArcPro I built a model that exports case data from my states health department. The model then reformats my export to have the appropriate date, county, and count fields. Using ArcPro, I then append this data to my hosted feature layer and save it (may want to hit the “Enable Undo” box just in case). This process automatically updates the data being used within my web applications. IMPORTANT NOTE: ArcGIS Online will assume the data being appended is UTC, I could not find a way to tell it otherwise. You must manually offset your date field to account for this. I was only concerned with the date being correct (not time) so for me as long as the data had a timestamp after 5:00AM for the day I was fine.