- Home
- :
- All Communities
- :
- Developers
- :
- Python
- :
- Python Blog
- :
- Table Tools for ArcGIS Pro... tools for working wi...
Table Tools for ArcGIS Pro... tools for working with tabular data
- Subscribe to RSS Feed
- Mark as New
- Mark as Read
- Bookmark
- Subscribe
- Printer Friendly Page
Table Tools...
- the link on ArcGIS Code Sharing...
- view code on GitHub tools_pro/table_tools/Scripts at master · Dan-Patterson/tools_pro · GitHub
This is a somewhat unorganized pictoral supplement to the tools contained there.
New additions
- Added nested means classification for classification of numeric data (2019-05-02)
- Added text file output to Crosstabulate and moved it to the Analysis menu (2019-02-23)
- Table to csv and table to text (2018-12-29)
- Statistics (2018-08-28)
- Running statistics added to the Statistics toolset (ie running means etc)
- Field calculator (2018-08-28)
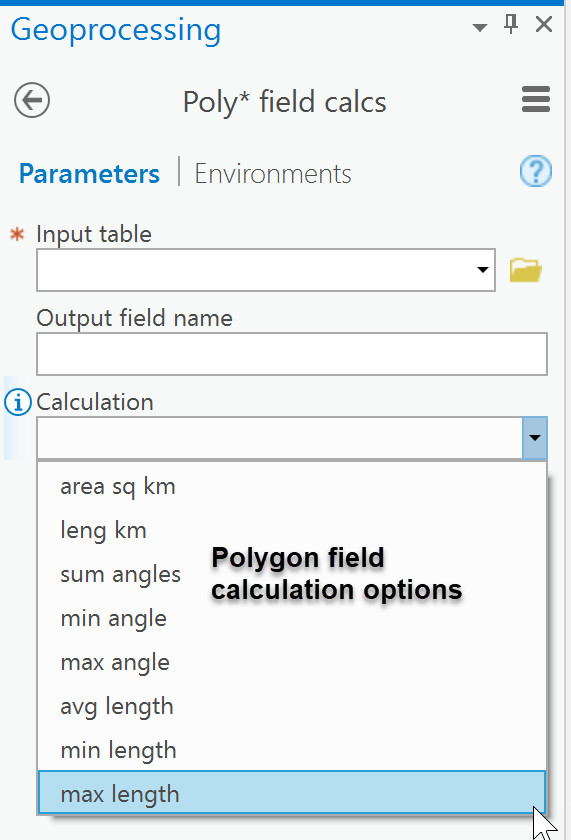
- Poly* field calculations : smallest/largest angle, min, max, avg length/perimeter
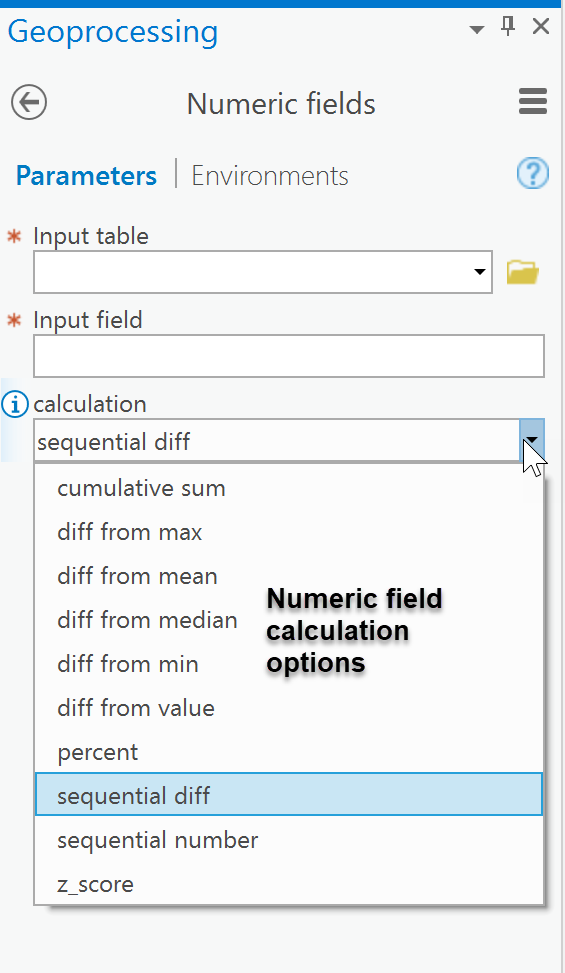
- Field calculator
- Calculations on numeric fields, includes a load of 'difference from .... ' type options, z-scores for fields etc etc
- Calculations for text fields.. currently the ability to identify text data in a field and provide a sequence number for it ie A A B A B A becomes A_00 A_01 B_00 A_02 B_01 A_03
- Calculations for geometry properties for polygon/polyline featureclasses including max_length, min_length, max_angle etc etc.
- Find sequences under Analysis
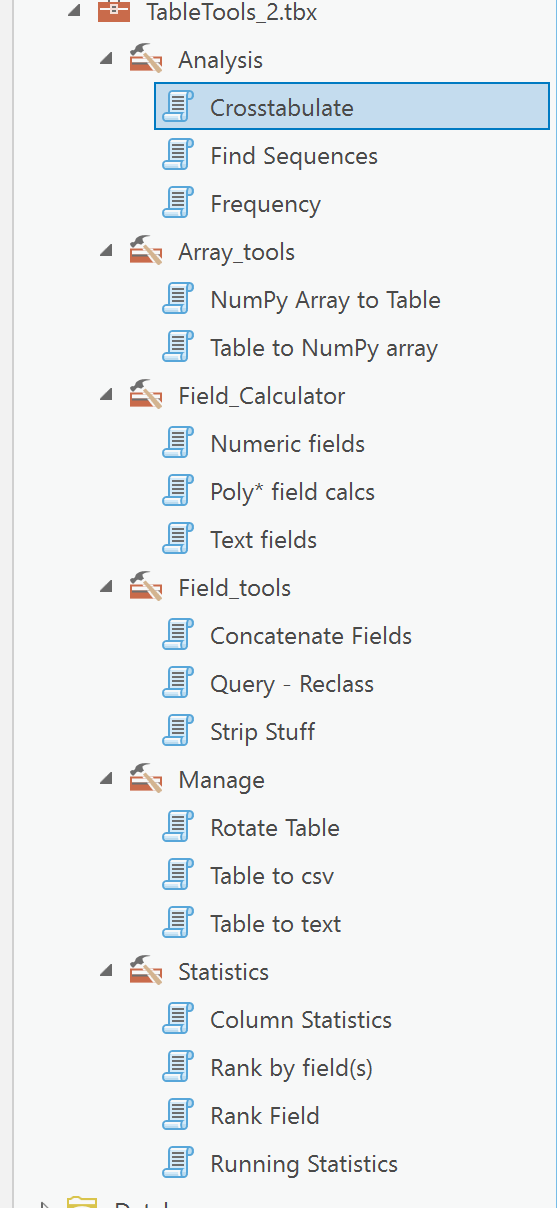
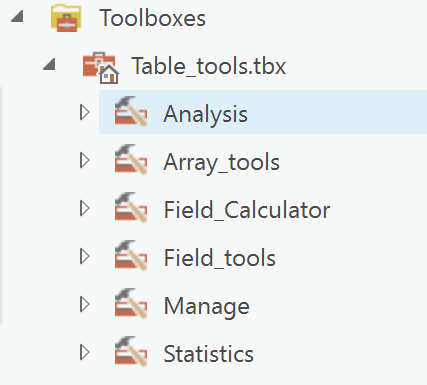
General Toolbox Layout
These images show the contents so far
:----------------------------------------------------------------------------------------------------------------------
Analysis Toolset
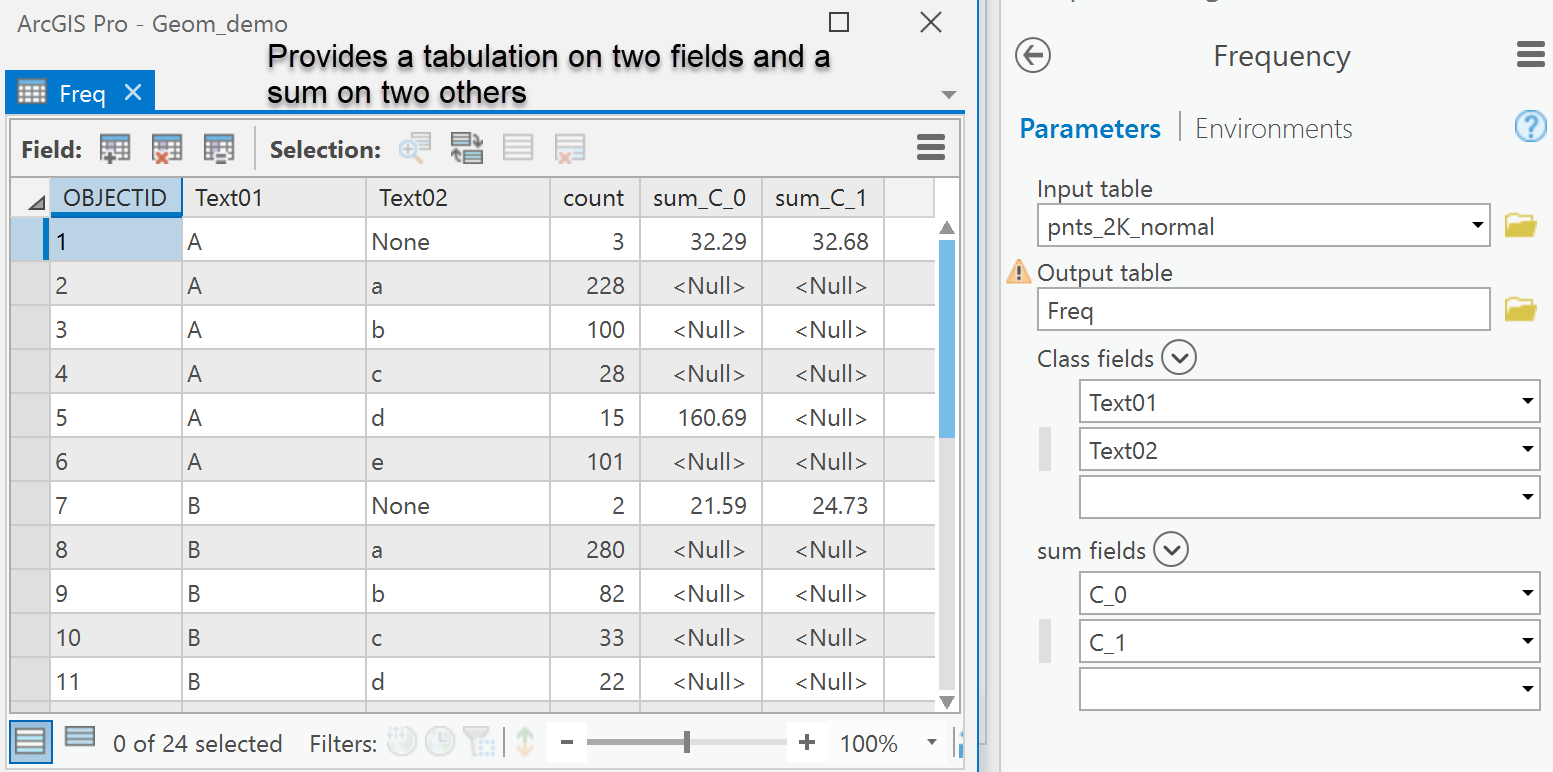
Frequency
Longed for the functionality of this tool with a Standard license? Here you go.
You can get the frequency counts by field pairing and a 'sum' on one or more fields.

With a sample output from the inputs.
Cross-Tabulation
The cross-tabulation tools does just that. Take two fields and get a cross-tabulation of their values. I will add multidimensional crosstabulation at some point when/if a demand surfaces.

:----------------------------------------------------------------------------------------------------------------------
Array_tools Toolset
 A handy conversion set, enabling the user to work with numpy arrays.
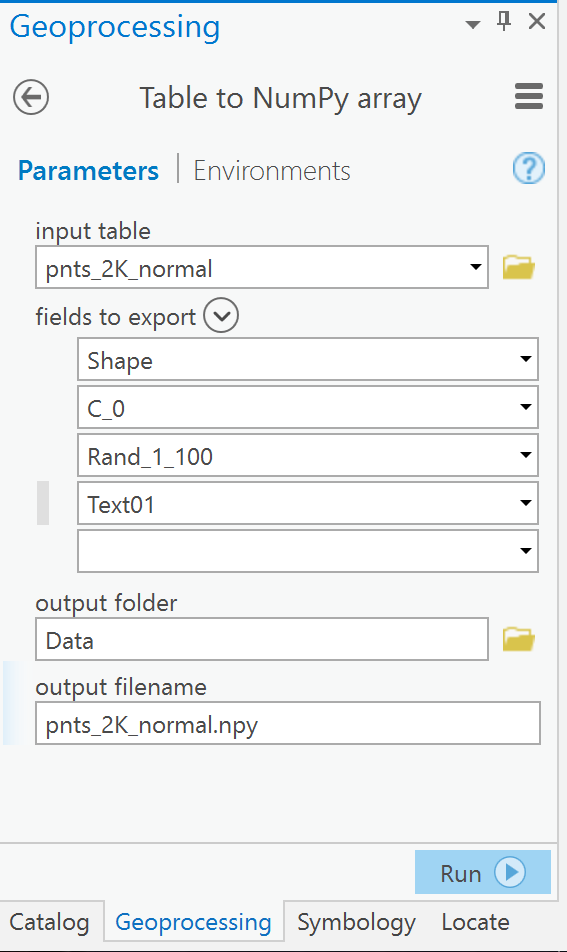
This is pretty self-explanatory. The reason that there isn't an 'All' option is that it only takes fewer lines of code to provide that option than to check to see whether people want All fields or selected fields exported to an *.npy file.
You can always pull out the line of code if you want all exported, otherwise, select the fields that you want exported and in the order that you want.
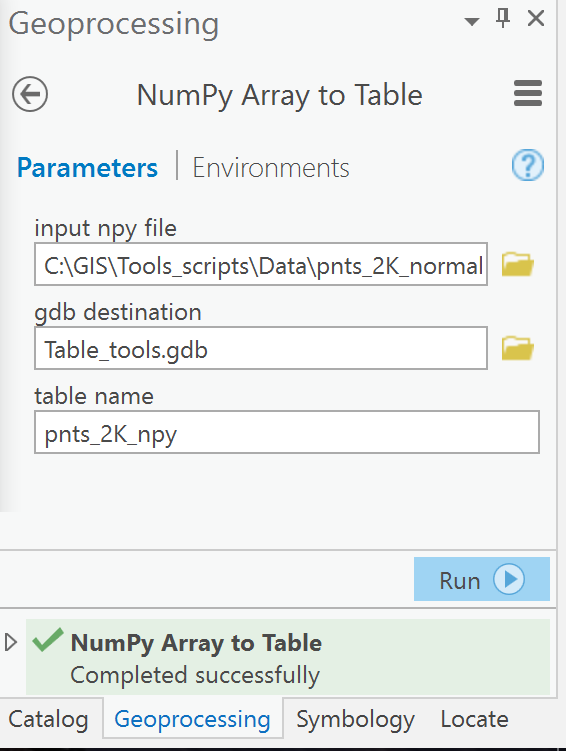
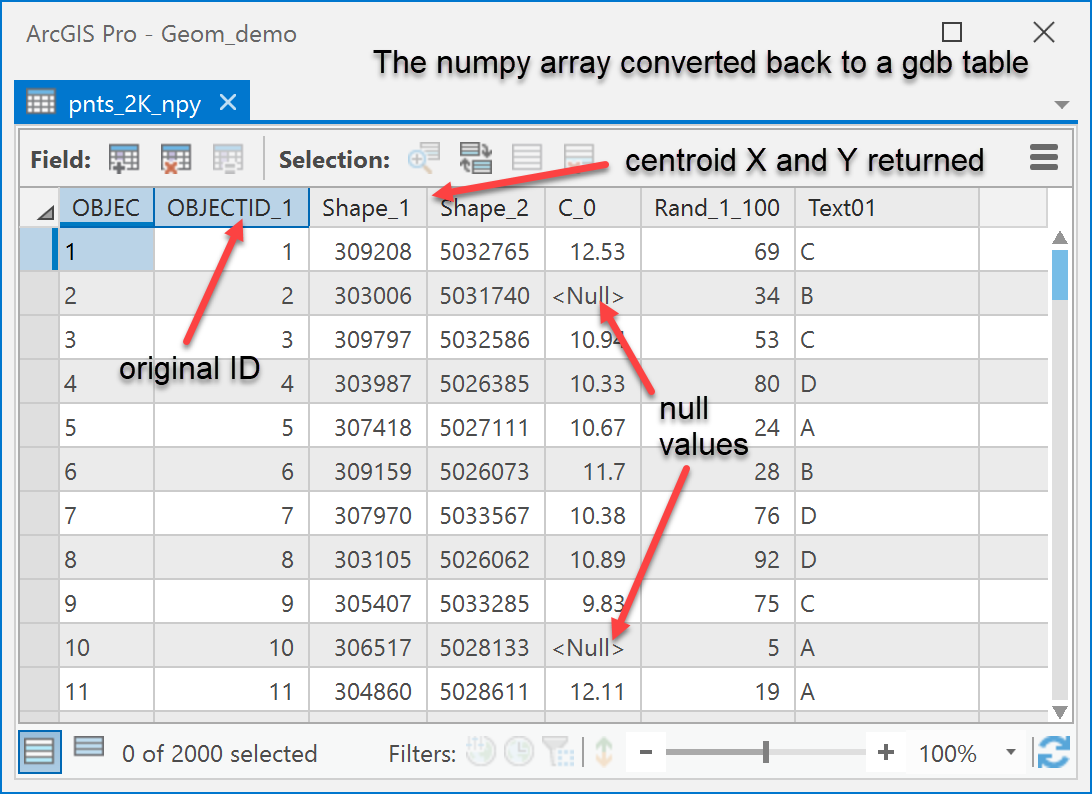
When the Shape field is exported, the centroid (regardless of geometry type) is used so that you can retrieve the X and Y coordinates when and if you import the data.
To reverse the process, simply use the Numpy Array to Table tool.
The basic setup and the resultant are shown below.
:----------------------------------------------------------------------------------------------------------------------
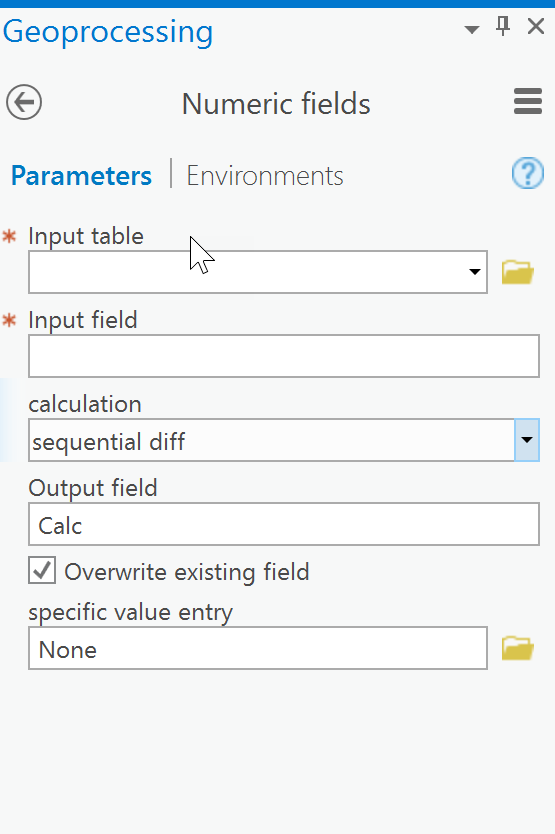
Field Calculator Toolset
Some of the optional tools in the field calculator toolset.
:----------------------------------------------------------------------------------------------------------------------
Statistics Toolset
Column Statistics
The tool allows you to specify the fields to summarize. Fields of 'Double' type are supported since you shouldn't be calculating statistics for integer fields... Do the conversion if you insist.
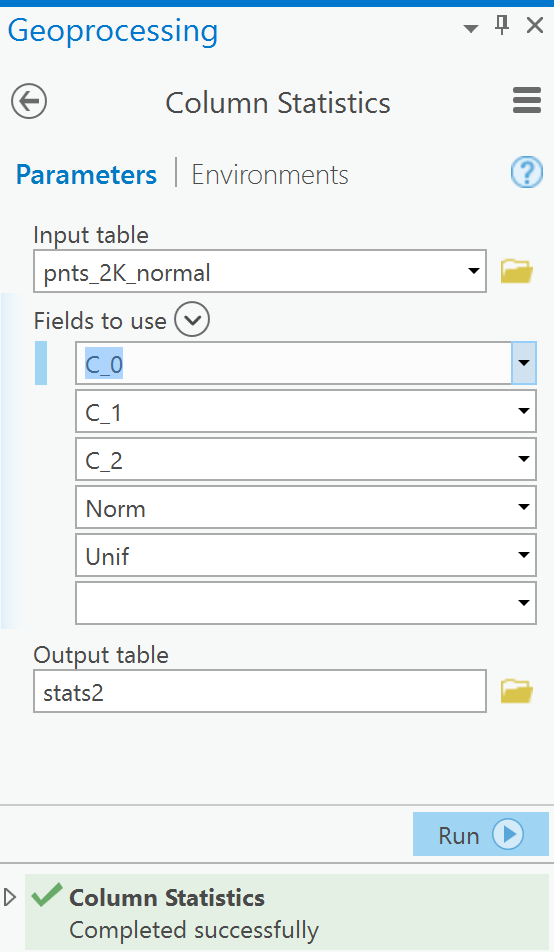
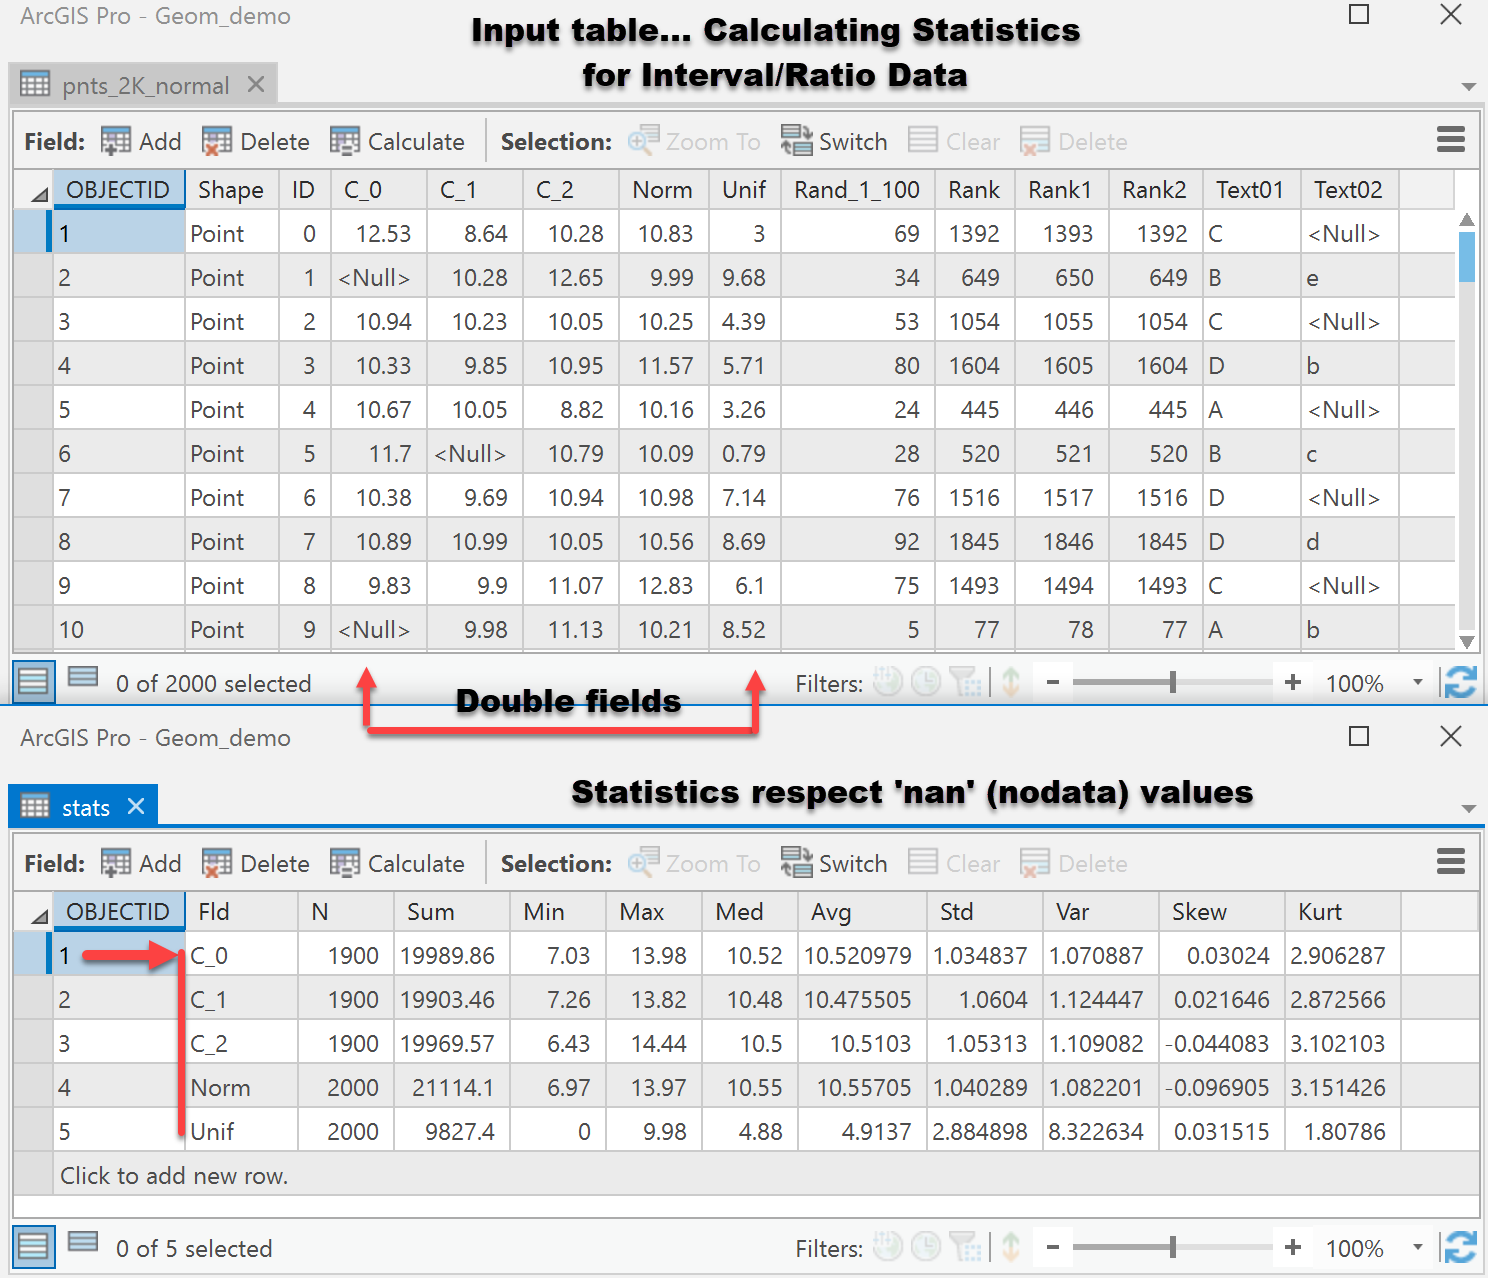
Here is a summary sample for 3 fields. Null values are accounted for in the calculation, so there is no need to exclude them prior to doing calculations.
As you can see, the traditional statistics are calculated and they include Skewness and Kurtosis which the current Summary Statistics in PRO tools don't. I will add the Case option when I feel the output looks nice  .
.
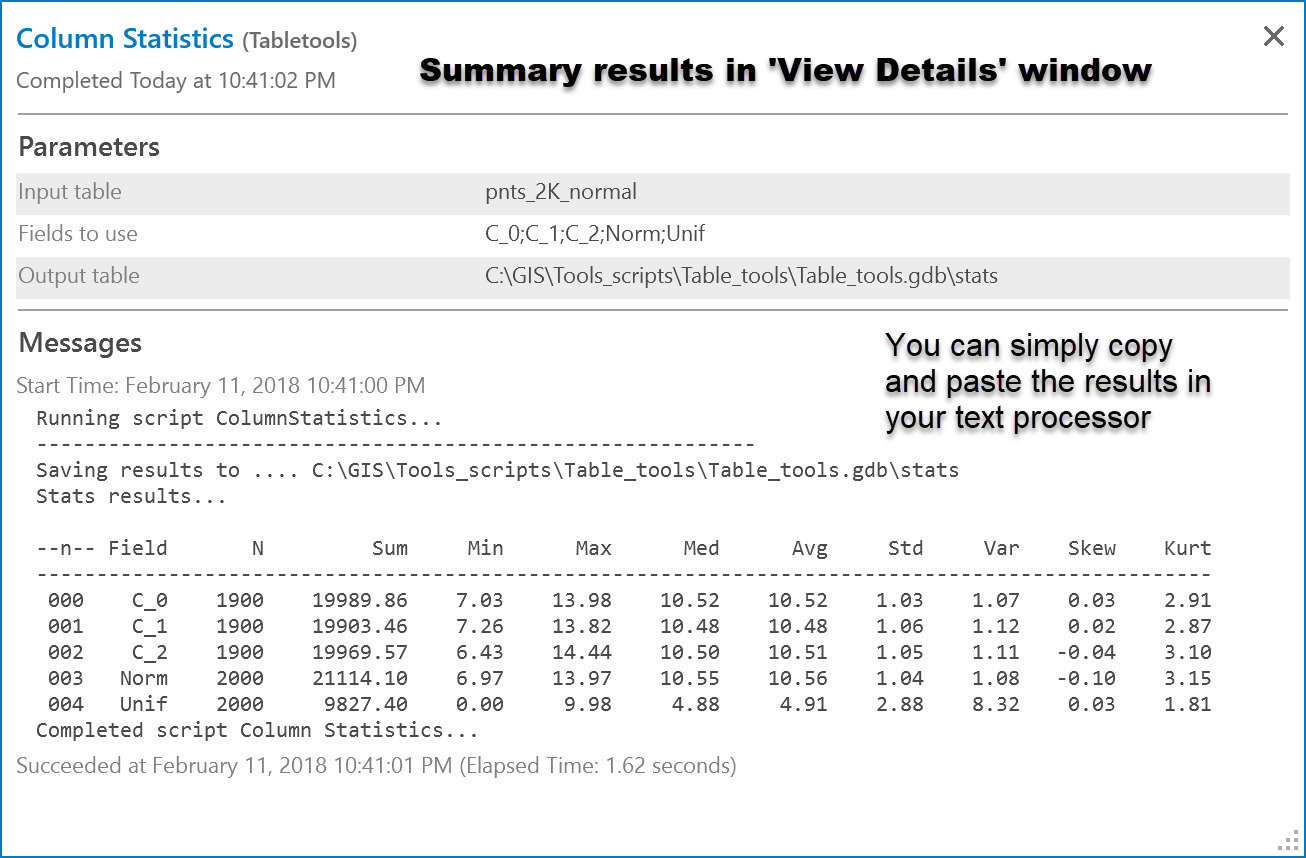
I even got fancy and included an alternate for displaying the data in the 'View Details' window. As it says... simply select all and copy and paste to your desired text editor.
Rank by Fields
Just does that... consider the following information in a 10K table on mass and size. You need a quick ranking, give it a whirl. You can not only get the biggest, biggests/smallest X, you can construct an ogive and derive other stats.
Here is a sample run and output.
![]()
![]()
:----------------------------------------------------------------------------------------------------------------------
You must be a registered user to add a comment. If you've already registered, sign in. Otherwise, register and sign in.