- Home
- :
- All Communities
- :
- ArcGIS Topics
- :
- GIS Life
- :
- GIS Life Blog
- :
- Story Map presentations instead of PowerPoint
Story Map presentations instead of PowerPoint
- Subscribe to RSS Feed
- Mark as New
- Mark as Read
- Bookmark
- Subscribe
- Printer Friendly Page
- Report Inappropriate Content
Last February I was preparing for a presentation at a conference. I intended to use a few PowerPoint slides to introduce the topics I wanted to cover, then switch to live web maps and apps to underscore the points I was going to make. There were about 10 topics I wanted to introduce and demonstrate, so this meant having to exit PowerPoint (or use the clumsy Alt-Tab) to switch back and forth between the slides and the demonstrations.
Then I realized that in this case a Story Map would be the perfect solution. I could use my PowerPoint slides in the story map, and as I advanced I could include the live web maps and apps without having to switch programs or toggle back and forth from PowerPoint. I chose Story Map Series as the presentation platform of my choice. Below on the left is the PowerPoint slide, on the right a web map, both in the Story Map I used for the presentation.

While any Story Map can be used to make a presentation, some are better suited to the task than others. My preference is the Story Map Series, specifically the bulleted layout, since it provides sequential access moving left to right. Map Series also doesn't require that you use a side panel for additional text or media - something not needed for most presentations.
Recently, just prior to the Esri 2015 User Conference, the Story Map Series bulleted layout was adjusted to make it well-suited for presentations by allowing more entries (30 is the max) and changing the placement of the bullets to prevent overlapping the main stage content.
Here are several examples from the User Conference that used the Story Map Series bulleted layout:
This example from the Esri UC uses a Story Map Journal:
In general if you are the one doing the presentation, I find the Story Map Series the best choice. If you want others to view and experience the presentation as well, the Story Map Journal might be the one to choose, since the side panel can include text, which can be thought of as the notes section on a PowerPoint slide, and can guide the viewer through your presentation.
Creating your presentation
It's simple to use a Story Map for presentations, just author and store your PowerPoint slides, collect other media, author needed maps and apps, and launch the builder for the Story Map you want to use.
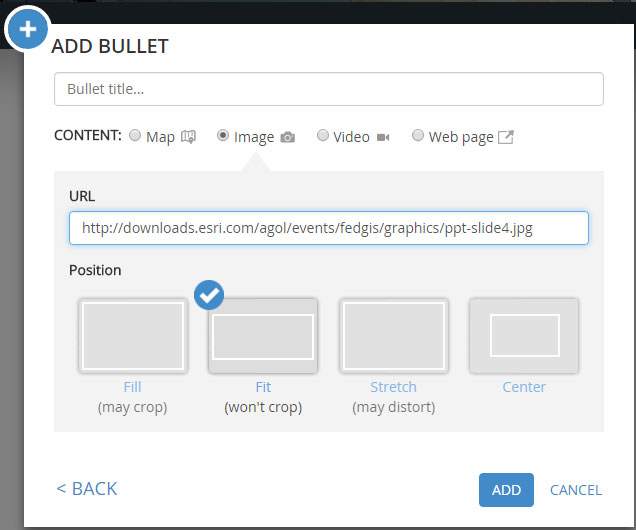
You can export your PowerPoint slides, or just capture them (I use Snagit, but any capture tool can be used). Once captured, place the slides at any URL-accessible location, then add them to your story map. A key consideration is using the proper position for your slides; you don't want text or graphics to be skewed or cropped. In general, Fit is the best all-purpose option that will accommodate any display resolution.

For several Story Map presentations at Esri events, I knew the exact display resolution (e.g., 1366 x 768). So I calculated the size my slides needed to be to fill the available real estate, added a handful of pixels on all sides to ensure they completely filled the space, then used a Position of Center. This technique only works when you purpose-build a presentation for a specific event, as when you use Center your slides will be cropped at different display resolutions. You can learn more by viewing Add PowerPoint slides to your Story Map.
Adding maps or apps is also very straightforward. Simply add them using their URL, and use Stretch as the Position option. Since the map viewer and most app templates are responsive, they'll fill the entire frame nicely. When embedding apps or other story maps, some templates enable you to minimize the UI. See Embedding a Story Map within a Story Map.
Considerations and Tips
Story Maps are a powerful way to tell a story using maps and media, and Story Maps can be a powerful way to deliver presentations. Some thought and planning will provide the best results. Here's a few things to consider.
- It's easy to author a terrible PowerPoint presentation, and we've all suffered through our share of them. Crafting a great Story Map is somewhat of an art, and a great Story Map presentation is no different.
- Limit the text in the Story Map so that the audience listens to you.
- Story Map presentations work best when they are short. The latest update to Story Map Series allows you to add a maximum of 30 tabs, bullets, or expandable side accordions.
- Story Maps do not offer the slide transitions and animations available in PowerPoint.
- Choose the best Story Map for your purpose. Map Journal is ideal for stories that need to be read as you can use the story narration on the left panel to add the necessary level of detail. However, if you are presenting a live story, the Map Journal narration might be distracting. Instead, try Map Series with its optional text panel.
- When using a Story Map Series or Journal and adding content via a URL that takes a while to initialize (like a detailed web scene), ensure that Unload when reader navigates away is unchecked. Before your presentation you can "warm up" all your maps and apps, and unchecking this option ensures they do not need to be reloaded when you reach that part of your presentation.

Additional resources
You must be a registered user to add a comment. If you've already registered, sign in. Otherwise, register and sign in.