- Home
- :
- All Communities
- :
- Products
- :
- ArcGIS Survey123
- :
- ArcGIS Survey123 Questions
- :
- Map Tour Limits and Dashboard Creation
- Subscribe to RSS Feed
- Mark Topic as New
- Mark Topic as Read
- Float this Topic for Current User
- Bookmark
- Subscribe
- Mute
- Printer Friendly Page
- Mark as New
- Bookmark
- Subscribe
- Mute
- Subscribe to RSS Feed
- Permalink
- Report Inappropriate Content
Hello,
I have an existing Survey123 connected to a Storymap Map Tour and Dashboard.
We want to expand this setup to include more than the limit of 200 map points (or connected survey entries); We'd love to have 1000+!
If we take this limiting tip: "A map tour created from scratch supports a maximum of 100 points. A map tour created from a feature service supports up to 200 points. To include more than 100 points, use additional map tour blocks to present them in a single story."
We could create a new block for each year of collection.... (not ideal)
But then how do we combine all blocks into one dashboard?
Help appreciated. Thanks
Solved! Go to Solution.
Accepted Solutions
- Mark as New
- Bookmark
- Subscribe
- Mute
- Subscribe to RSS Feed
- Permalink
- Report Inappropriate Content
@JenMcRuer when you have a lot of points in a Map Tour, the user experience can be very poor. Especially if the part you are relying on is a user navigating the list of points by scrolling. Imagine a user's experience when you have 1000 survey entries listed, and they need to scroll down to find the 721st survey entry. Ugh!
You don't say what your trying to achieve overall in your post in terms of user scenarios, however, I would guess it is not the navigation of the list of 1000 survey entries a Map Tour provides. Rather, perhaps you are interested in the user experience that the map part of a Map Tour provides? Where a user can pan and zoom the map to view data, and can click on points on the map to view more information about specific entry?
If that is the case, and you did mention Dashboards, have you considered using a Dashboard, instead of Map Tour? You could use a Dashboard to provide a similar user experience as that provided by the map part of a Map Tour, and then embed the Dashboard in your StoryMap in place of the Map Tour block (assuming there is more to your story than just the Map Tour.)
For example, create a Dashboard and add a Map and a Detail element, both pointing to your data. Then configure the Map and Layer actions for the Map to (1) drive the Detail element to only appear when a point is selected on the Map, (2) show the selected point's data, and (3) to disable the popup on the Map so you aren't showing duplicate data. Then when a user is exploring your data on your map, they can click on a point to view its details.
Below is a visual example from a student project on tracking balloon debris in the Great Lakes region. A survey with 922 records when it ended. By selecting points on the middle-bottom map a user drives what is displayed on the right:

- Mark as New
- Bookmark
- Subscribe
- Mute
- Subscribe to RSS Feed
- Permalink
- Report Inappropriate Content
@ShareUser - We are not considering raising the limit to the number of locations you can add to a single tour at this time.
However, if you would like to create an idea on the ArcGIS StoryMaps Ideas board and provide more information about how/why this would be helpful to you other community members will be able to vote for your idea if they are also interested in this enhancement.
Some things I would recommend that you include in your idea are answers to some of the questions below:
- Who do you expect the audience to be for this map tour, and how you expect them to interact with the tour?
- Do you expect no/any/some/all readers to scroll through all 1000+ locations and read about every one or would they be looking for a specific location? If they are looking for a specific location, how would they find what they are looking for?
- What is the main function of the tour within the story? What is the main purpose of the story that contains the tour? Is the tour more of a reference resource or a communication tool?
- What is it about the tour that is appealing to you?
Having answers to these questions would be helpful for us to understand how you'd like the tour to be used. If there is another set of use cases that our current tour layouts don't cover, we could consider enhancements to the map tour or even new layouts to help meet these needs.
- Mark as New
- Bookmark
- Subscribe
- Mute
- Subscribe to RSS Feed
- Permalink
- Report Inappropriate Content
I can create an idea, with your suggestions - thank you.
However, it still does not solve my question: without the option available now to have more than 200 map tour points, so taking the "work around" of creating several blocks, how to combine these into one dashboard?
- Mark as New
- Bookmark
- Subscribe
- Mute
- Subscribe to RSS Feed
- Permalink
- Report Inappropriate Content
It sounds like you already have a single feature layer with all the survey results, right? If you need to show that data in several different tours I don't think the problem is combining data for a dashboard (the original service already contains all the data), rather it's separating it. Am I understanding the issue correctly?
If so, here are a few suggestions:
- Map tours also support feature layer VIEWS, so you could create views of your main data service that show data from different time windows or however you want to break it up so each one has <200 points. You can then use the views to create different tours.
- There is an option in the map tour Data options (the same place where you adjust the number of points shown) to sort the places coming from your feature layer. You can use this to show the most recent 200 points, which ensures the latest data is shown in the tour. If you don't have a need to have all the older points shown in the tour, you could use this option. Many customers who use tours to show survey results use this option since older survey results are often not as relevant as the latest ones.
- Use some type of data management workflow (manual using the ArcGIS Online analysis tools or automated using a Python script or notebook) to duplicate portions of the survey data as needed into other layers to meet the requirements of each app where you want to display it.
- Mark as New
- Bookmark
- Subscribe
- Mute
- Subscribe to RSS Feed
- Permalink
- Report Inappropriate Content
@JenMcRuer when you have a lot of points in a Map Tour, the user experience can be very poor. Especially if the part you are relying on is a user navigating the list of points by scrolling. Imagine a user's experience when you have 1000 survey entries listed, and they need to scroll down to find the 721st survey entry. Ugh!
You don't say what your trying to achieve overall in your post in terms of user scenarios, however, I would guess it is not the navigation of the list of 1000 survey entries a Map Tour provides. Rather, perhaps you are interested in the user experience that the map part of a Map Tour provides? Where a user can pan and zoom the map to view data, and can click on points on the map to view more information about specific entry?
If that is the case, and you did mention Dashboards, have you considered using a Dashboard, instead of Map Tour? You could use a Dashboard to provide a similar user experience as that provided by the map part of a Map Tour, and then embed the Dashboard in your StoryMap in place of the Map Tour block (assuming there is more to your story than just the Map Tour.)
For example, create a Dashboard and add a Map and a Detail element, both pointing to your data. Then configure the Map and Layer actions for the Map to (1) drive the Detail element to only appear when a point is selected on the Map, (2) show the selected point's data, and (3) to disable the popup on the Map so you aren't showing duplicate data. Then when a user is exploring your data on your map, they can click on a point to view its details.
Below is a visual example from a student project on tracking balloon debris in the Great Lakes region. A survey with 922 records when it ended. By selecting points on the middle-bottom map a user drives what is displayed on the right:
- Mark as New
- Bookmark
- Subscribe
- Mute
- Subscribe to RSS Feed
- Permalink
- Report Inappropriate Content
Thank you, again, for this solution.
In trying to implement, I am stuck at how/where to (1) drive the Detail element to only appear when a point is selected on the Map, (2) show the selected point's data?
In the dashboard element settings, I don't see an obvious place to do this.
I have added my map inclusive of data layer points (pop ups disabled), but I'm not sure how to create the record and image elements (as you show in your photo), such that when a map point is clicked, they appear.
Any help/guidance you can provide, is much appreciated.
Thank you!
- Mark as New
- Bookmark
- Subscribe
- Mute
- Subscribe to RSS Feed
- Permalink
- Report Inappropriate Content
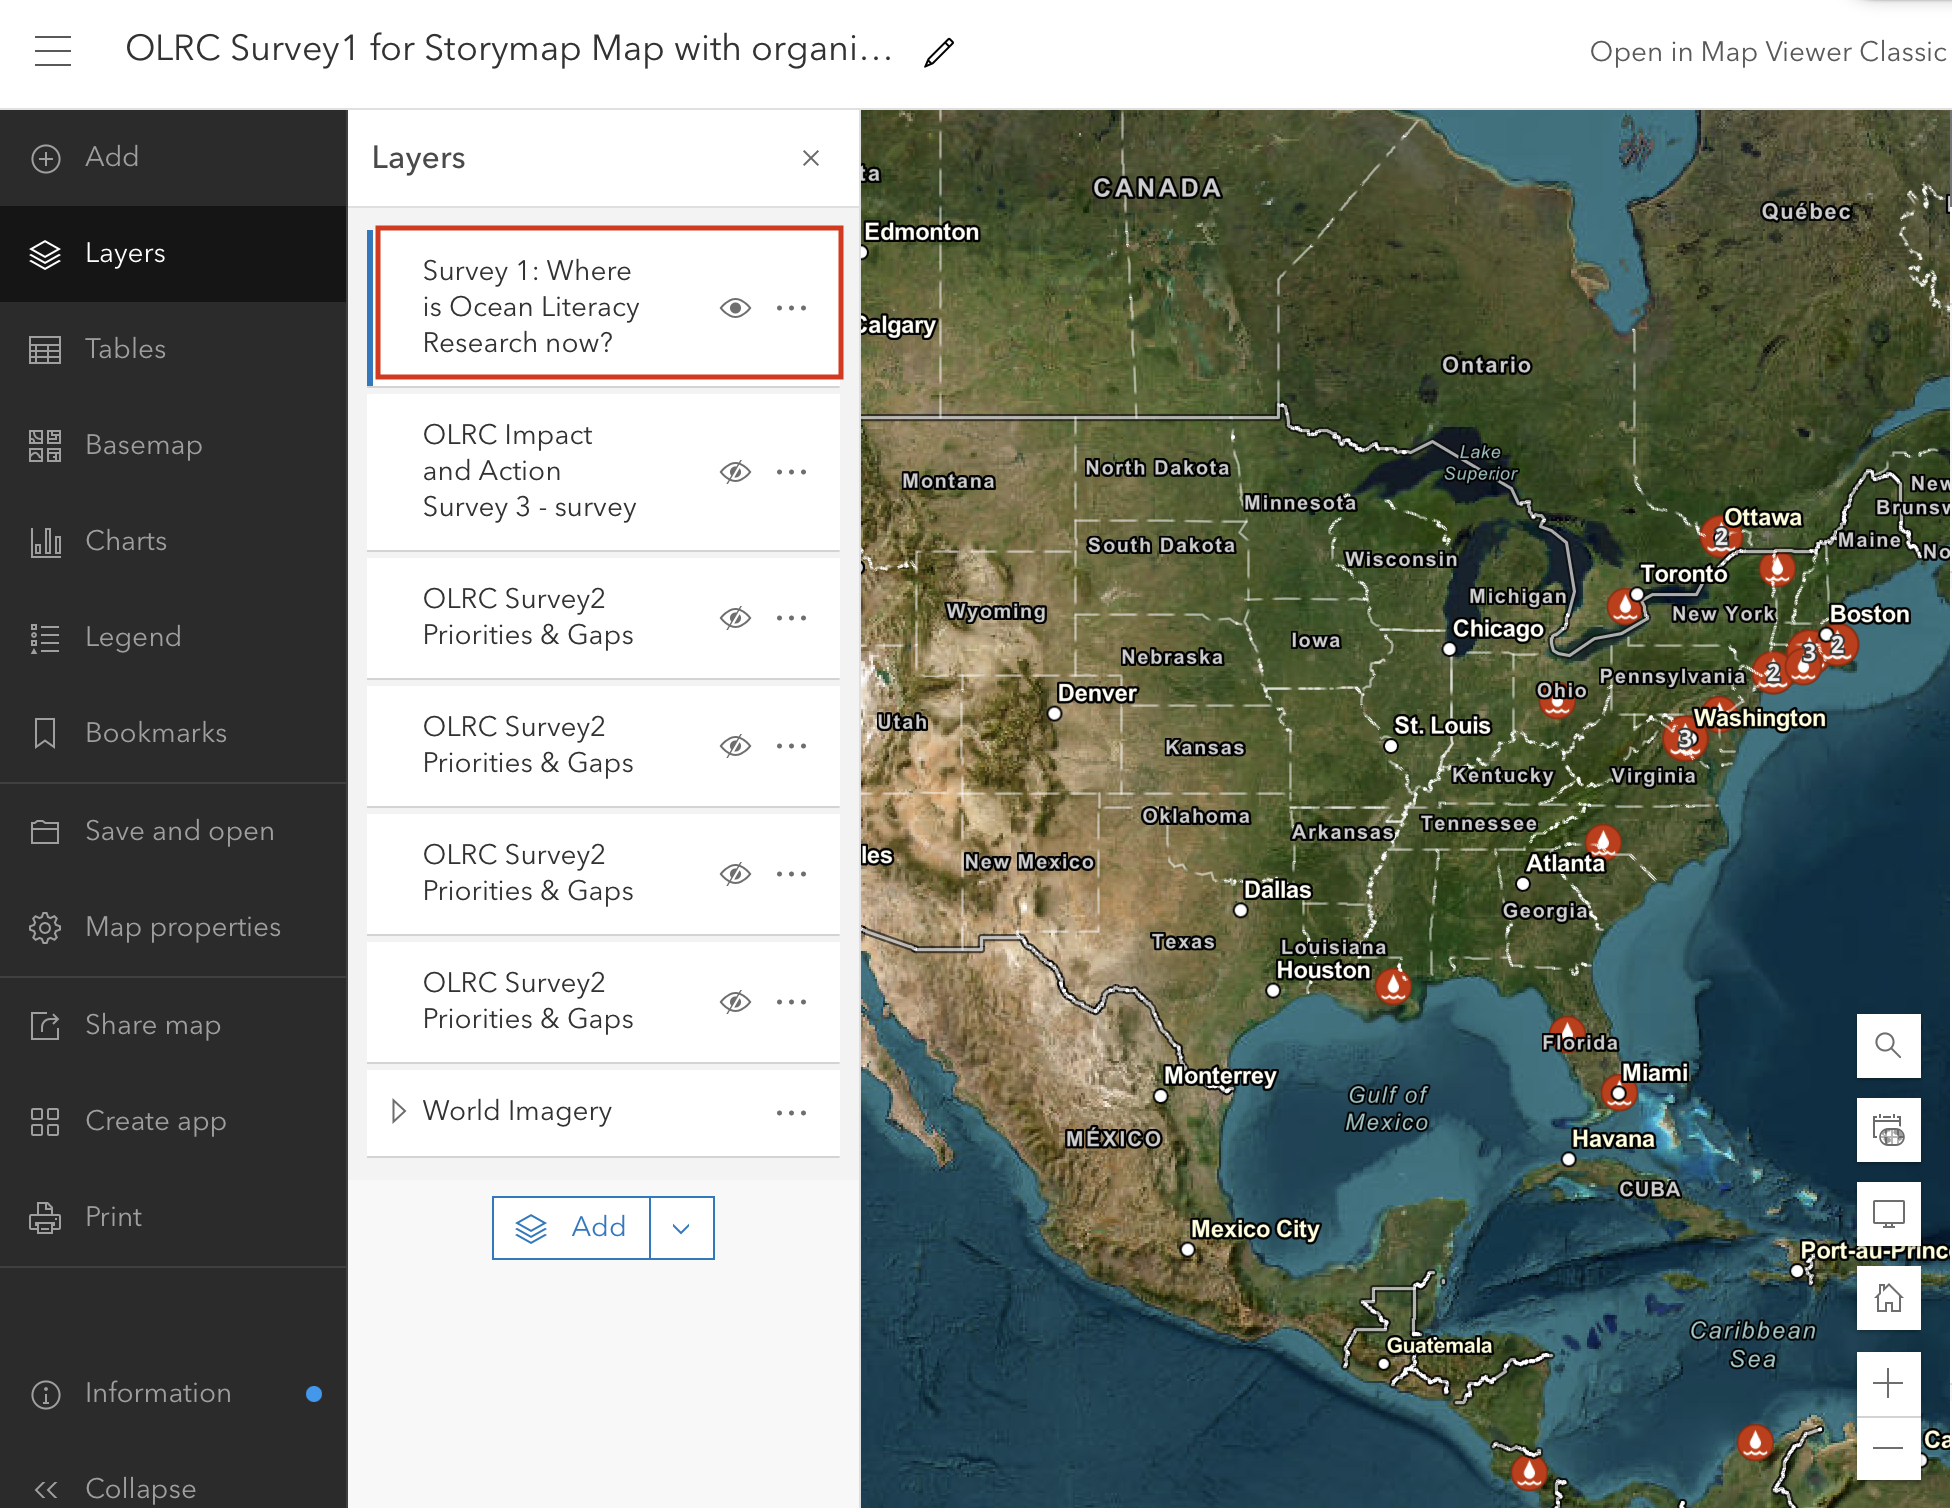
@JenMcRuer here's a very basic example dashboard, with a Map element on the left and a Details element on the right, and both are using the same feature layer as their data source:

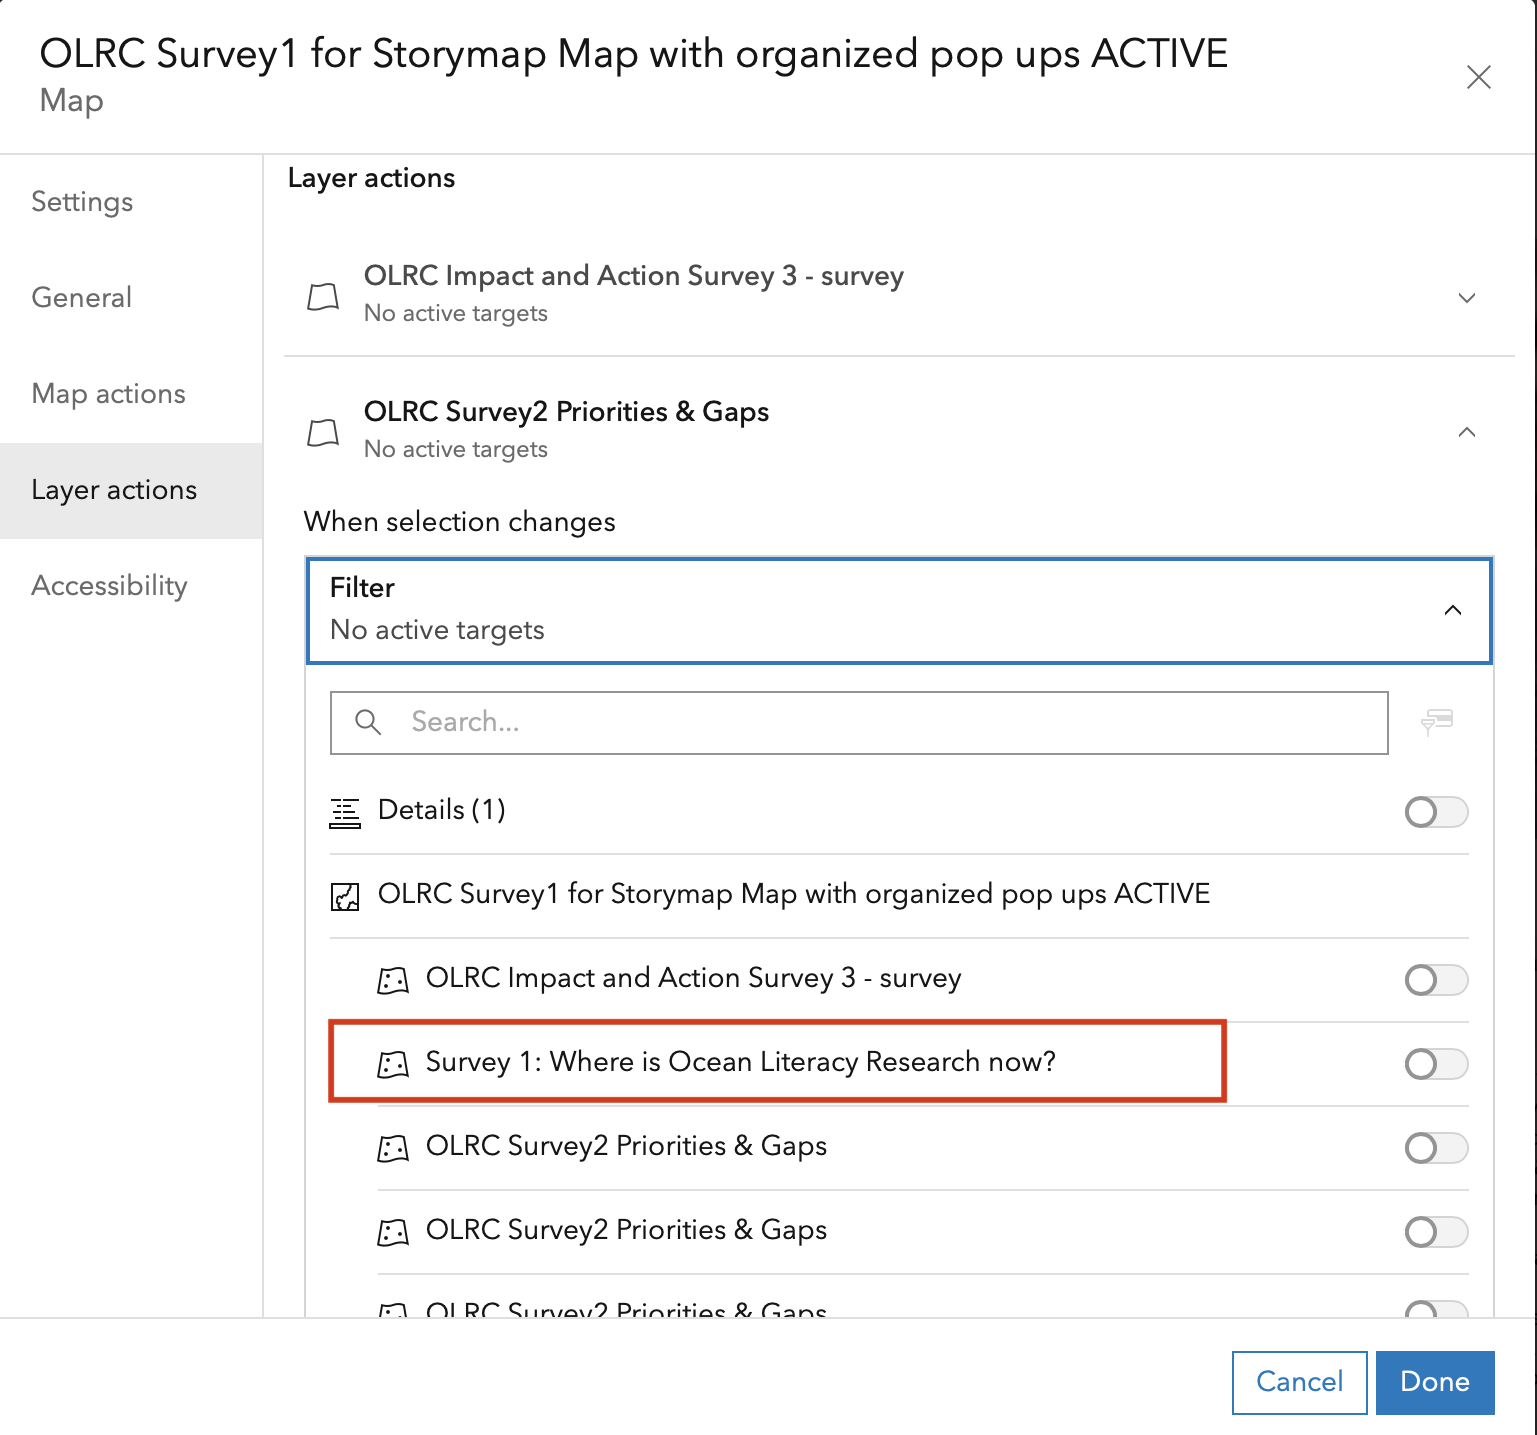
Under the Map's settings, for Layer actions, enable filtering of the Detail element (Selected Report) and check the box for "Render only when filtered." The former filters the data source feeding Selected Report to the current selection in the map, while the latter ensures Selected Report displays blank (as above) if nothing is selected on the map.

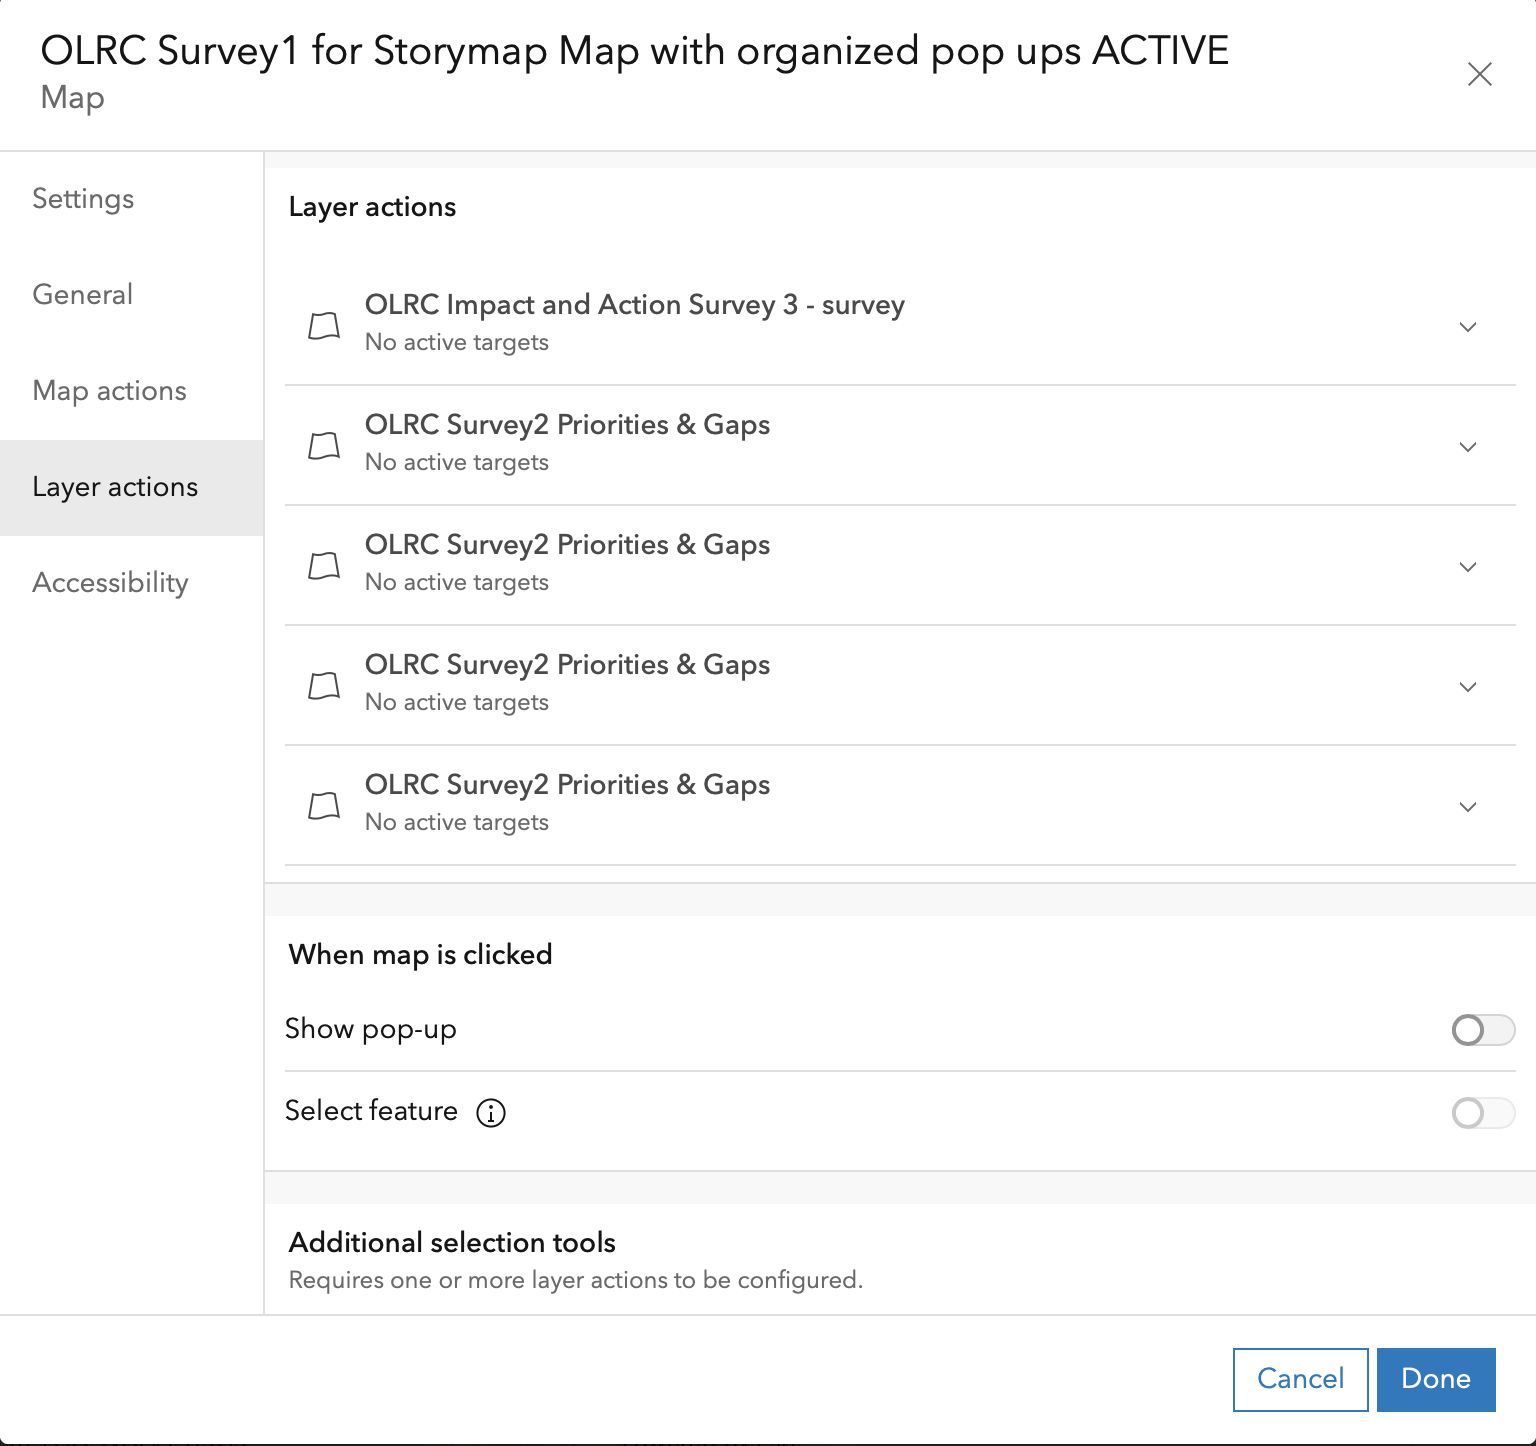
Also above, under "When map is clicked", turn off "Show pop-up", so that when a user clicks on a point on the map, the web map's pop up (if it has one) is not displayed. And, turn on "Select feature", so that the feature(s) clicked on in the map become selected, and the actions under "When selection changes" are triggered, displaying the selection's information in the Selected Report:

Check out these resources:
Hope that helps!
- Mark as New
- Bookmark
- Subscribe
- Mute
- Subscribe to RSS Feed
- Permalink
- Report Inappropriate Content
Thank you for this help in follow up. I think where I'm stumped, is that in the dashboard map settings, not all of my layers are showing (particularly the one I need to link to the records), despite it being visible and viewable in other views inside and outside of dashboard. YET, among the layer action>layers listed, it is listed under the filter options....? Any suggestions for how to fix this issue, so I can follow your above steps with the correct layer?
- Mark as New
- Bookmark
- Subscribe
- Mute
- Subscribe to RSS Feed
- Permalink
- Report Inappropriate Content
@JenMcRuer its hard to say without more information about the map and layers you are using.
I would suggest starting from scratch, and building a simpler example than what your screen shots came from. It might make it easier to see where things are going wrong (or to get things right, and then add other layers and elements to the mix 🙂
For example, create a web map that has only the layer you need in it (Survey1?). Create a Dashboard and add that web map to a Map Element. Then add a Detail element to the Dashboard, and make sure you point it at the exact same data source your web map is using. Then configure your desired actions. Hopefully that produces a working Dashboard that you can compare to the one that isn't working as expected, or gives you a working base which you can continue to work on adding other content.
- Mark as New
- Bookmark
- Subscribe
- Mute
- Subscribe to RSS Feed
- Permalink
- Report Inappropriate Content
@PeterKnoop Thank you. After starting form scratch, and it not working, I spent time looking through all of my layers for sharing settings and anything differences between the layers that were showing and the one layer that was not. I found nothing out of sync. I then went back to the dashboard and reloaded/deleted, reloaded/delated the map 10+ times...and finally, the layer showed up. So the only thing I can discern was a glitch in the platform??
Alas, it is now working. Thankfully!
My next question for you, if I may: I now have the map and records syncing. The records are from survey123, data collected in 2022. I would like to continue to add data points to this layer using the same survey, BUT to delete some of survey questions first, to simplify. Will there be any issue created with the currently stored data/records if I edit the survey (that will continue to link with the syncing map /record details on the dashboard?) Thank you