- Home
- :
- All Communities
- :
- Products
- :
- ArcGIS Dashboards
- :
- ArcGIS Dashboards Questions
- :
- AGO Operations Dashboard - Chrome vs IE, SHAPE.STL...
- Subscribe to RSS Feed
- Mark Topic as New
- Mark Topic as Read
- Float this Topic for Current User
- Bookmark
- Subscribe
- Mute
- Printer Friendly Page
AGO Operations Dashboard - Chrome vs IE, SHAPE.STLength() field, multi-condition variables
- Mark as New
- Bookmark
- Subscribe
- Mute
- Subscribe to RSS Feed
- Permalink
I'm using Operations Dashboard for well... an operations dashboard - and I've run into some issues.
1. Certain things don't work in Chrome, such as seeing all the layers shared in a feature service; they are all visible when using IE (second attachment);
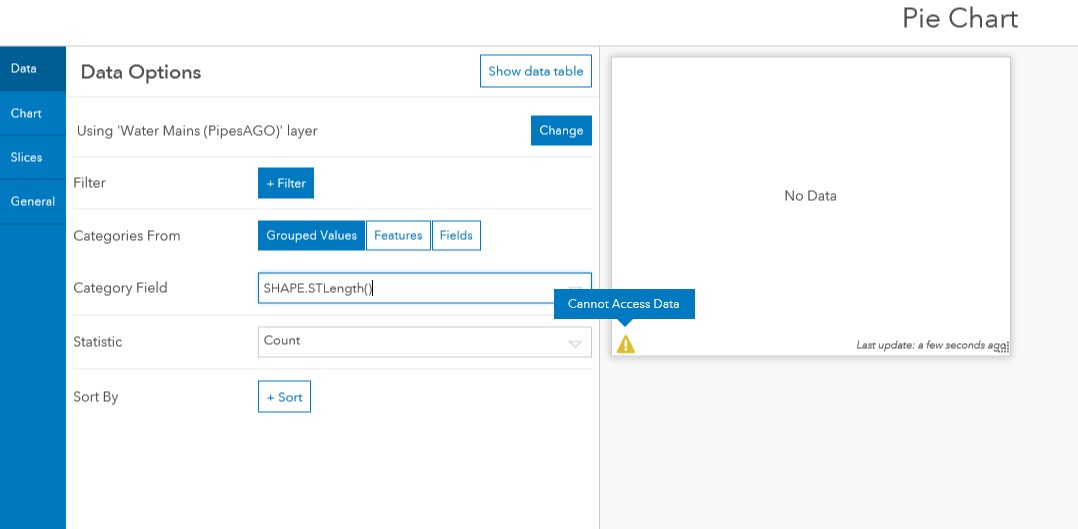
2. Unable to create visual elements based upon the SHAPE.STLength() field - it gives me a 'Cannot Access Data' error; I need to use this field for a 'current miles of main/laterals' display (first attachment);
3. Unable to create a multi-condition pie or line chart, using variables, such as - meters can start with a SR*, TR*, or RR* - attached devices can start with ERT* or AMR* - I need to build a chart with each of these variables - the counts of SRs with ERTs, SRs with AMRs, RRs with ERTs, etc.
It's great to have these dashboard tools, but seem to be extremely limited on their usages. Thanks in advance.
dsr
- Mark as New
- Bookmark
- Subscribe
- Mute
- Subscribe to RSS Feed
- Permalink
Hello,
I am just curious if you able to figure out the error. I have the same problem regarding "cannot access data" error.
Thanks!
- Mark as New
- Bookmark
- Subscribe
- Mute
- Subscribe to RSS Feed
- Permalink
I've heard nothing - you are actually the first person to reply to my post from a month ago! 
- Mark as New
- Bookmark
- Subscribe
- Mute
- Subscribe to RSS Feed
- Permalink
Sorry to hear that...hope we would get answers.
I am just wondering why this error appear. In my situation, this error appear on and off, if you refresh the it works well, then if you refresh again, the error appear again.
- Mark as New
- Bookmark
- Subscribe
- Mute
- Subscribe to RSS Feed
- Permalink
Same issue here and no clues.
- Mark as New
- Bookmark
- Subscribe
- Mute
- Subscribe to RSS Feed
- Permalink
*bump to any help Esri Technical Support can provide...
- Mark as New
- Bookmark
- Subscribe
- Mute
- Subscribe to RSS Feed
- Permalink
As a follow-up - I finally was able to connect with support on my case yesterday:
- ESRI recognizes that Chrome works best in all AGO applications, so they develop them toward that platform.
- I opened a case with ESRI Support - there is now no issue with the SHAPE.STLength() field, in doing Count-Sum graphs... I don't know what they changed in the past few months, but now it is working.
- The multi-conditional issue: Setting multiple filters helps with this issue, however there is no way to overlap multiple multiples... if that makes sense. You'll have to build one graph/chart with one set of variables, and a separate one for the others.
Dan