Turn on suggestions
Auto-suggest helps you quickly narrow down your search results by suggesting possible matches as you type.
Cancel
- Home
- :
- All Communities
- :
- Industries
- :
- Water Resources
- :
- Water Resources Questions
- :
- Prevent polygon feature (catchment) overlap
Options
- Subscribe to RSS Feed
- Mark Topic as New
- Mark Topic as Read
- Float this Topic for Current User
- Bookmark
- Subscribe
- Mute
- Printer Friendly Page
Prevent polygon feature (catchment) overlap
Subscribe
3995
1
08-22-2015 12:55 AM
08-22-2015
12:55 AM
- Mark as New
- Bookmark
- Subscribe
- Mute
- Subscribe to RSS Feed
- Permalink
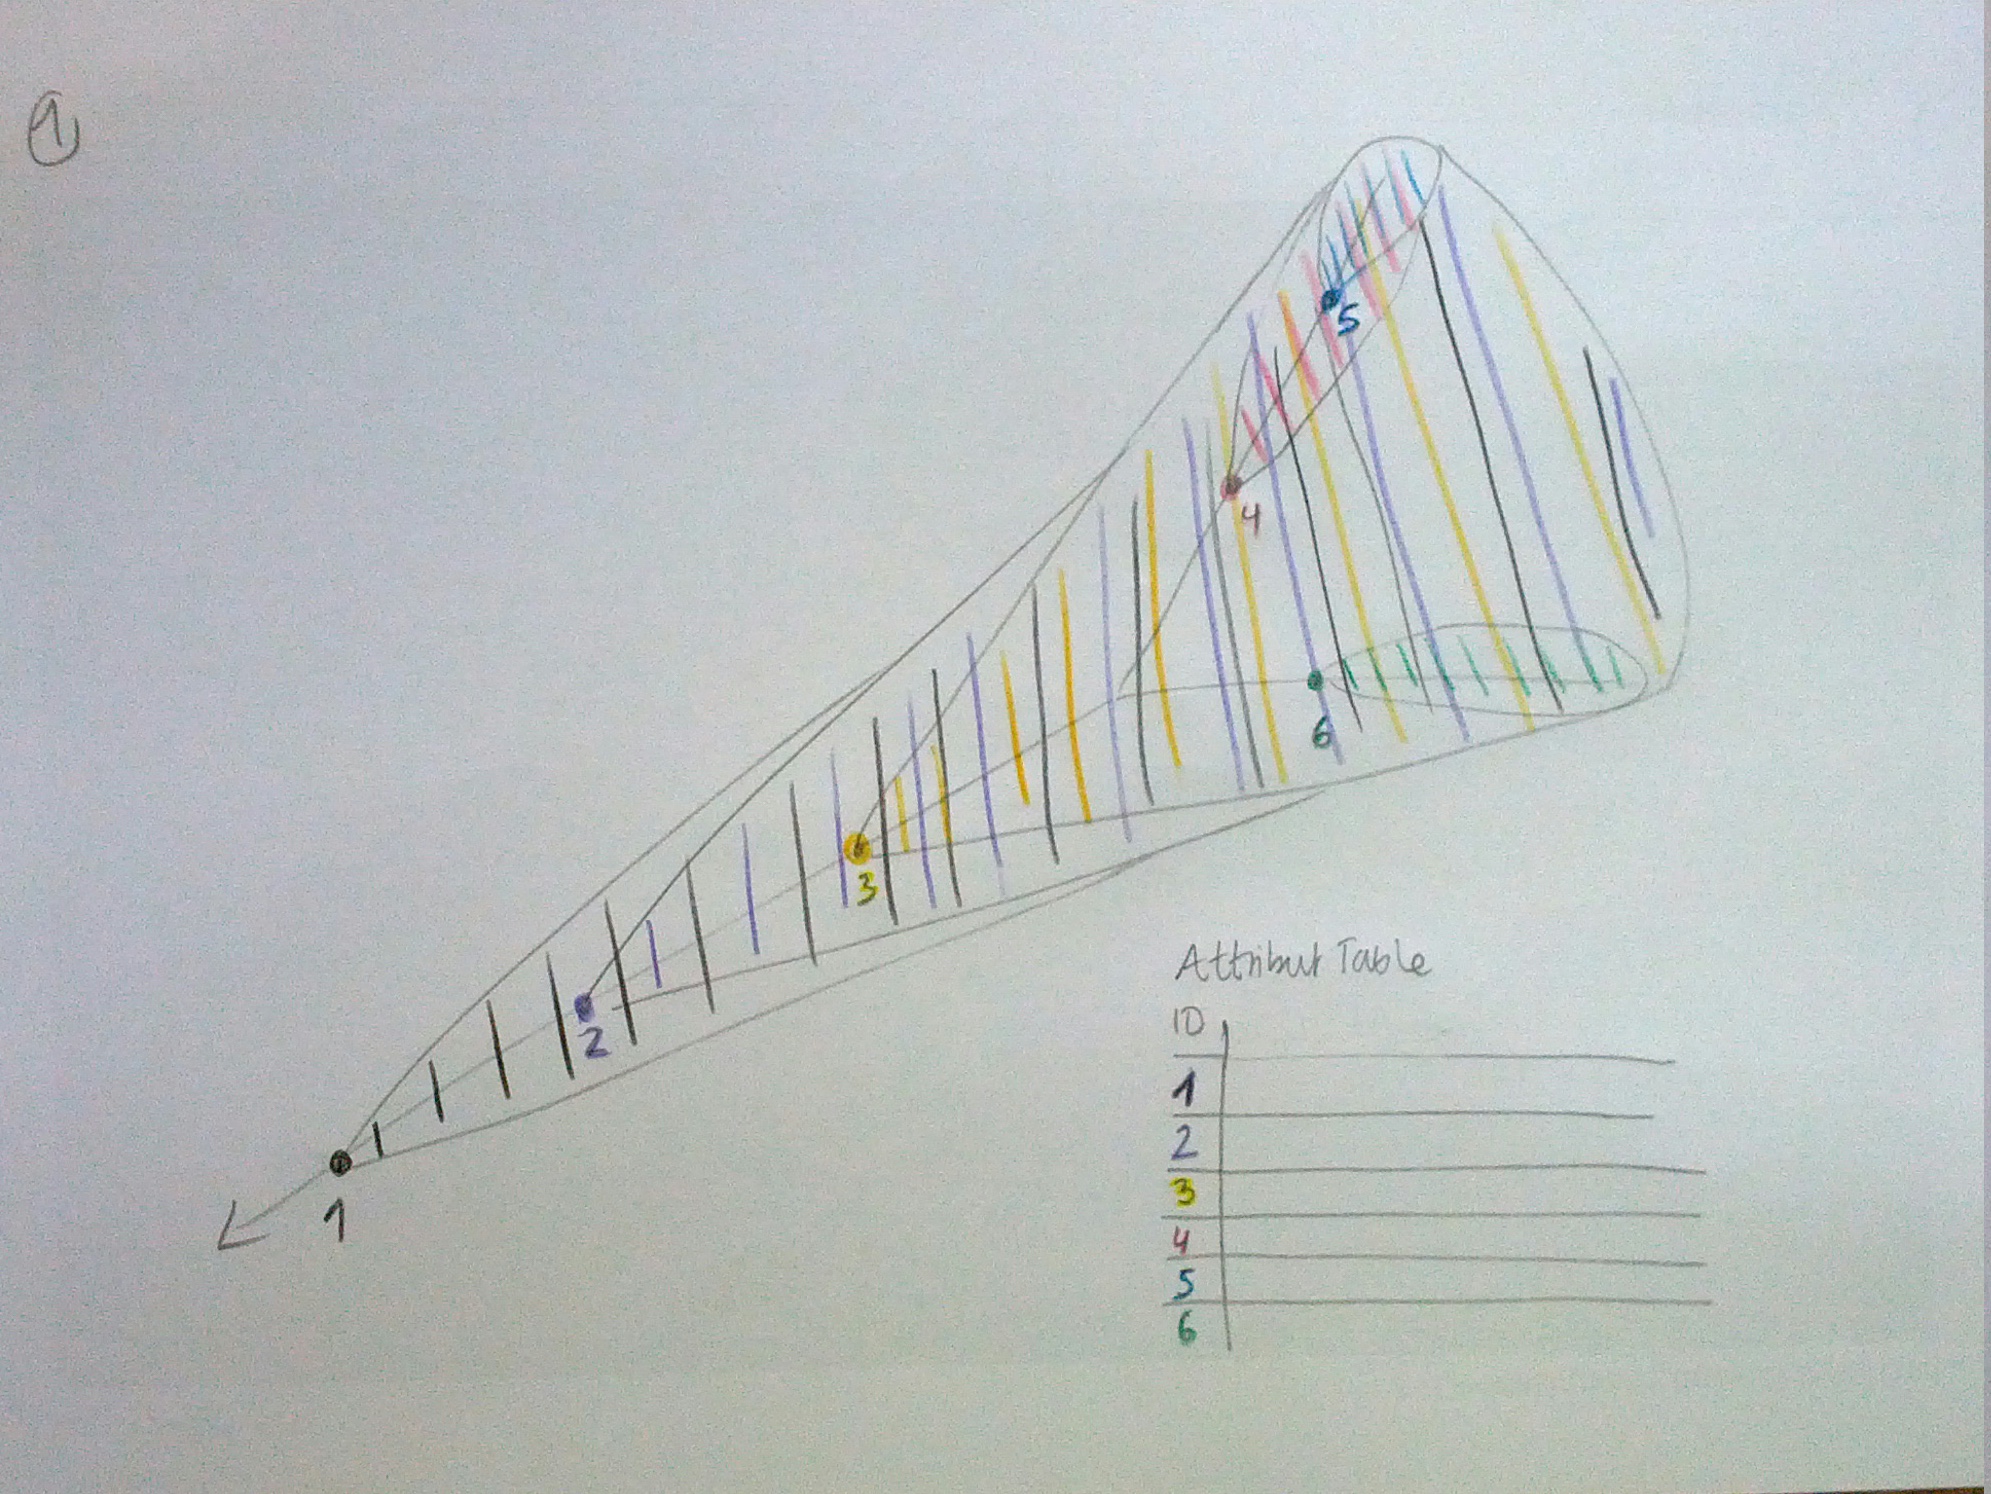
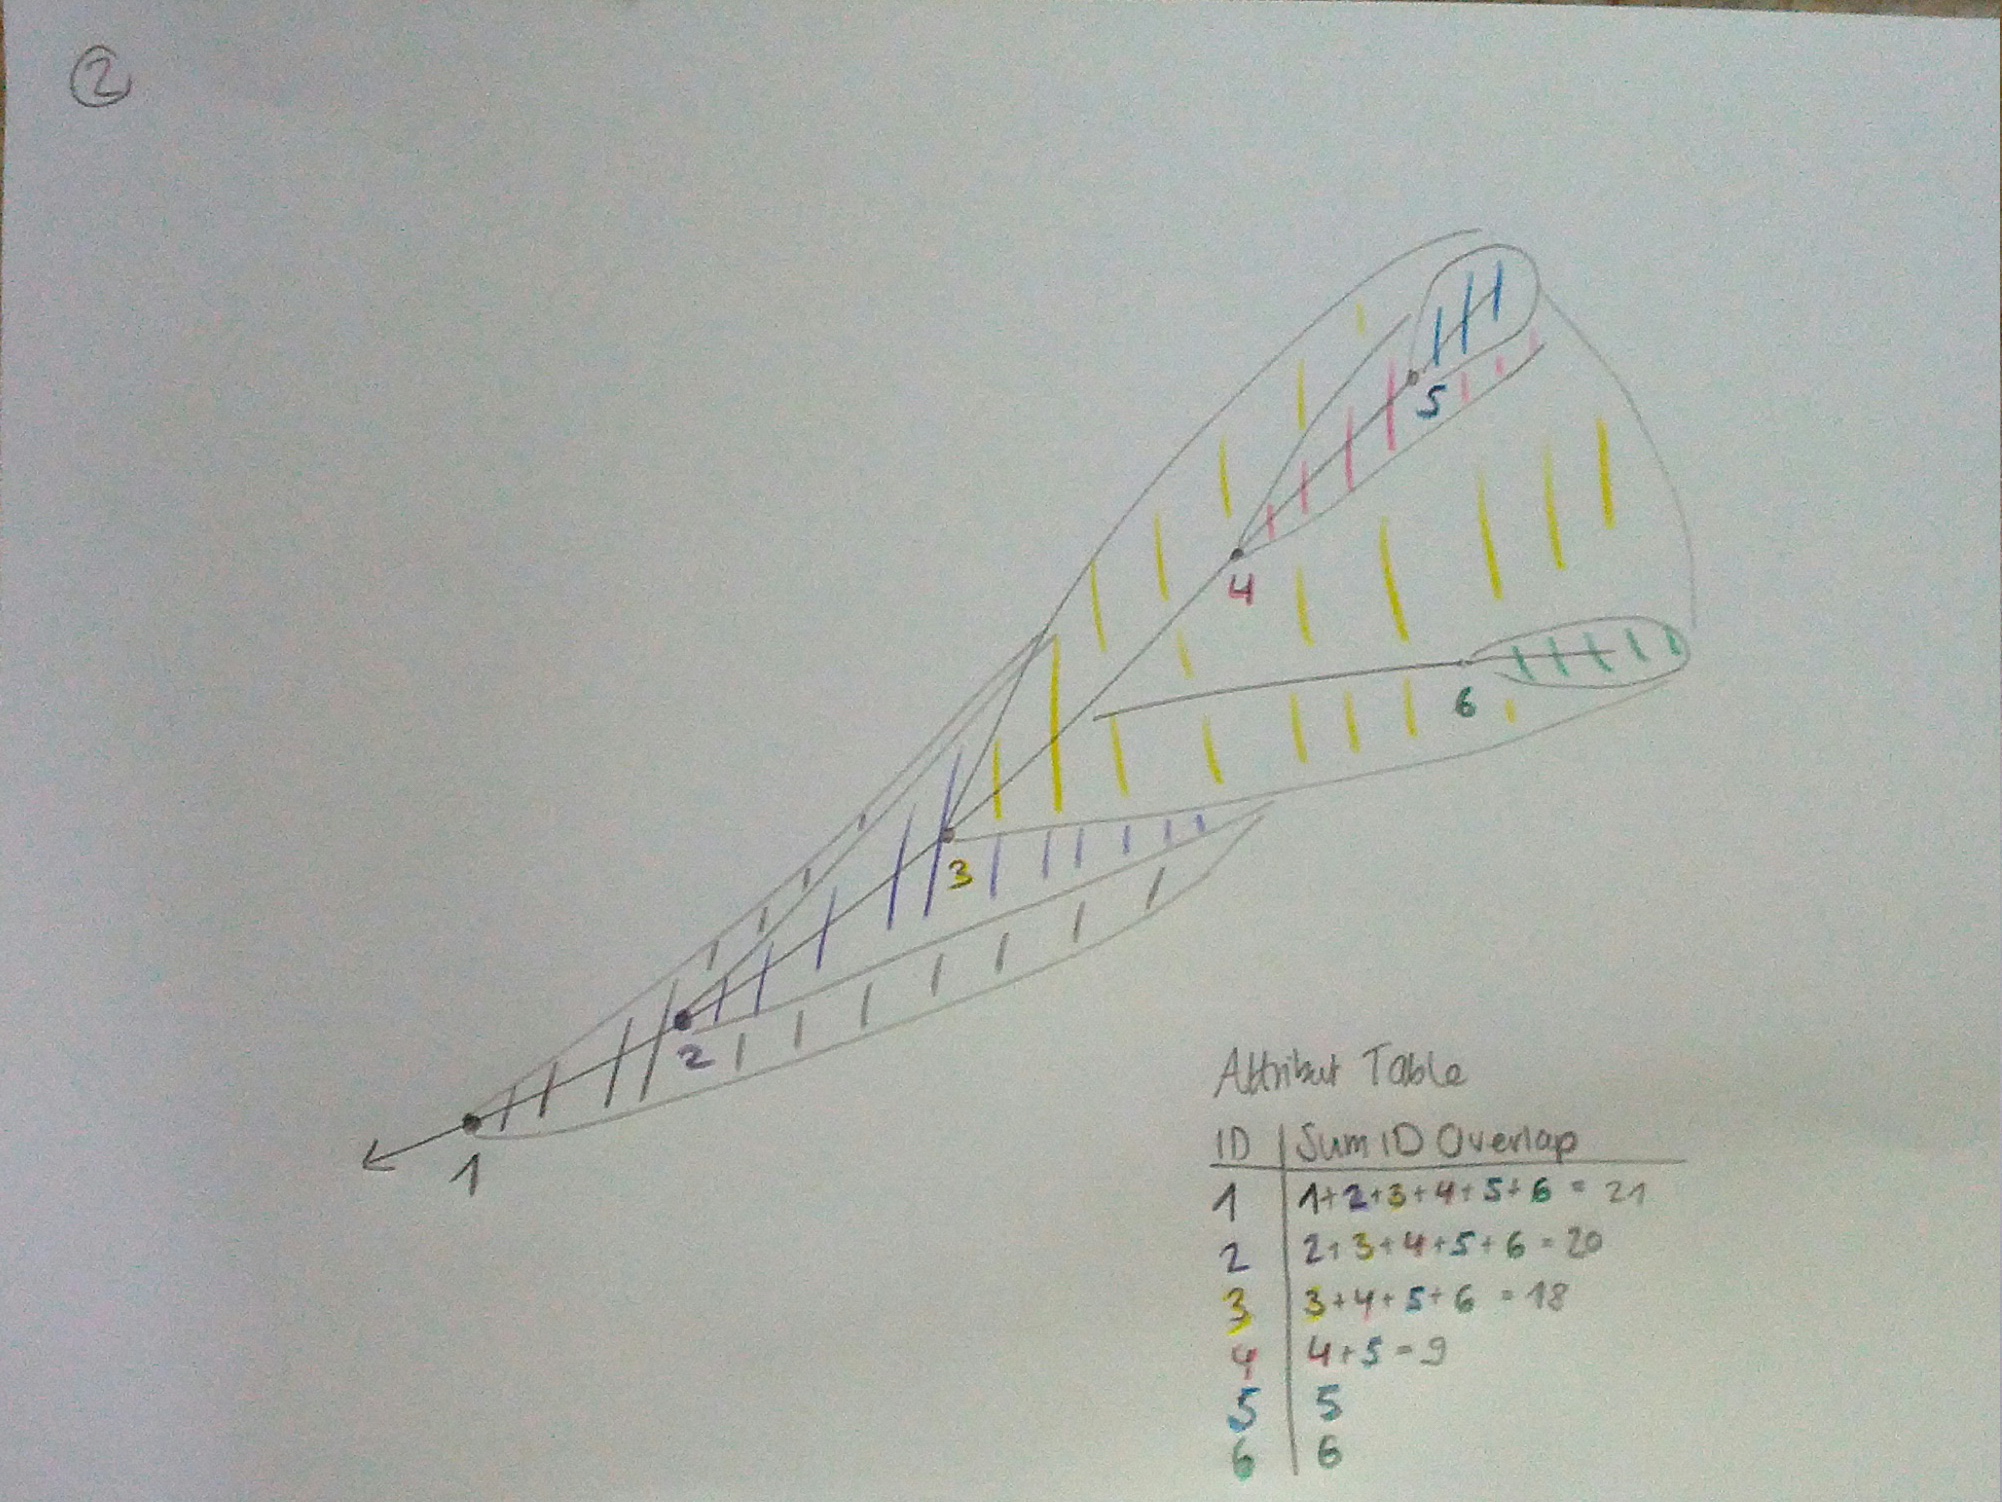
My aim is to calculate catchments for around 150 points and to extract land-use variables for them. In order to do so I need a vector dataset where no polygons overlap. This, however, seems to be a challenging task.
Presume, that I already calculated the catchments for all 150 points (see Figure 1; here only points 1-6 are visualized):
- How do I get from the overlapping catchment features in Figure 1 to the none overlapping catchment features in Figure 2?
- How can I associate the catchment features to previous overlaps? I thought of adding up the IDs (see 'Sum ID Overlap' in the attribute table in Figure 2). Can this be done automatically?
1 Reply
09-02-2015
12:10 PM
- Mark as New
- Bookmark
- Subscribe
- Mute
- Subscribe to RSS Feed
- Permalink
It may be easier to just do run each adjoint catchment one at a time through zonal statistics.
Re: Zonal Statistics as Table: Overlapping Polygons: Solution Required