- Home
- :
- All Communities
- :
- Industries
- :
- Telecommunications
- :
- Telecommunications Blog
- :
- Cell Site Location Optimization
Cell Site Location Optimization
- Subscribe to RSS Feed
- Mark as New
- Mark as Read
- Bookmark
- Subscribe
- Printer Friendly Page
By now, its pretty well known that the 5G technology and the spectrum frequencies being used to deliver on the promises of better wireless speeds and latency will require lots of small cells. The amount of infrastructure being deployed to deliver 5G far exceeds previous wireless technologies, and therefore the amount of CAPEX being invested is far greater than ever before. So wireless carriers need to be more strategic in where they deploy 5G in order to get the highest ROI. And this is where GIS can help. So in this blog I'll outline a few GIS based spatial analysis tools that can be used to optimize the locations and placement of cell sites in order to get the highest return with the least amount of CAPEX spent.
Suitability Modeler
A suitability model is used to determine the best location to site things or areas to preserve, like locating the best locations to place cell sites. The new Suitability Modeler in ArcGIS enables you to create a suitability model in an intuitive, integrated framework. The following image illustrates the sample suitability model workflow for cell site suitability:
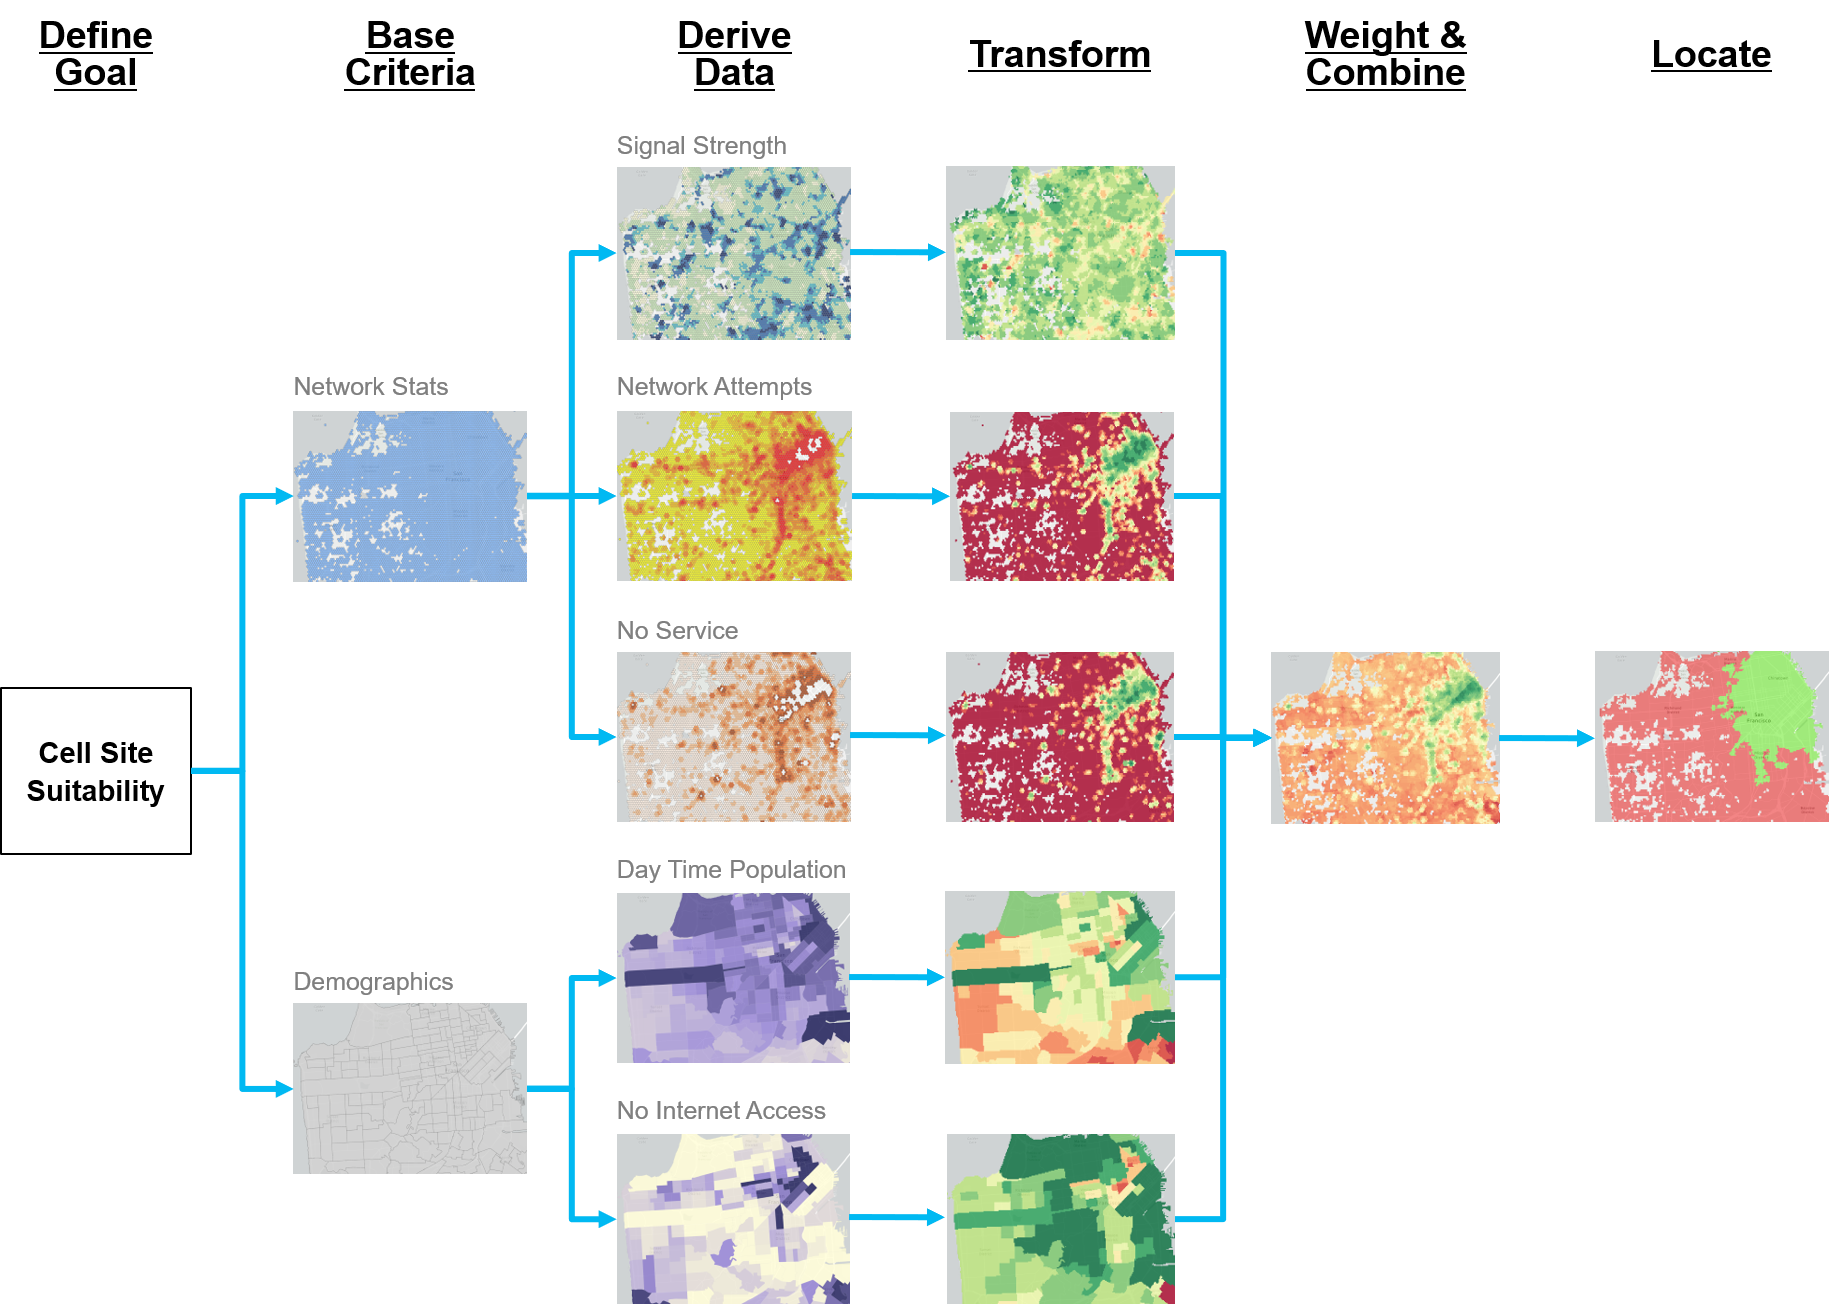
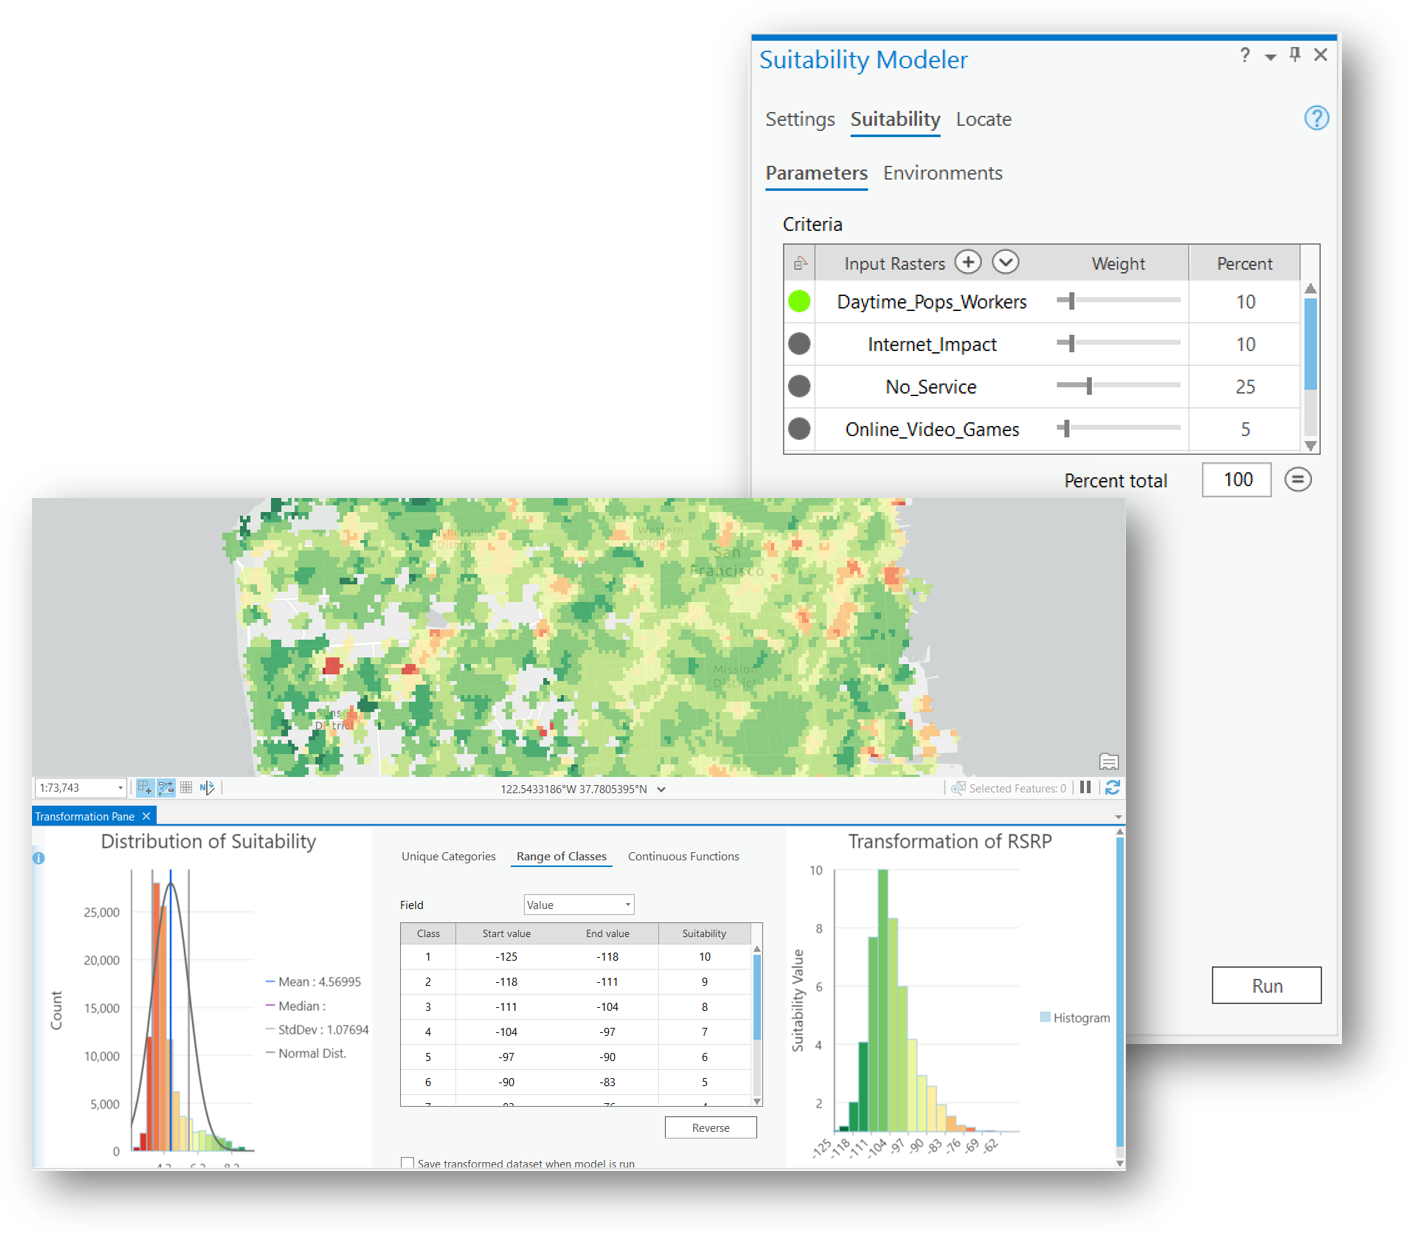
Since determining the ideal locations for a cell site can be based on multiple factors and different criteria, suitability analysis allows you to look at existing network statistics or call records as well as demographics, and weight them accordingly to come up with the best areas that address all of these variables. The Suitability Modeler through ArcGIS Pro offers an easy to use transformation pane to reclassify and transform your input datasets, along with charts to see the distribution of your data.
The results of the suitability analysis provide you with areas that are highly suitable. This suitability map can be used to locate structures within highly suitable areas for small cell deployment, and can also be used to optimize the location allocation of cell sites, which we'll discuss later in this blog.
Closest Facility
A second big driver of cell site placement is proximity to existing OSP facilities. Traditional calculations of nearest fiber cable or network access point relied of straight line crow flies distance. This straight line distance doesn't accurately reflect the potential path of a fiber backhaul. The Closest Facility tool in ArcGIS allows you to calculate the street distance which more accurately represents the route a fiber cable will take.
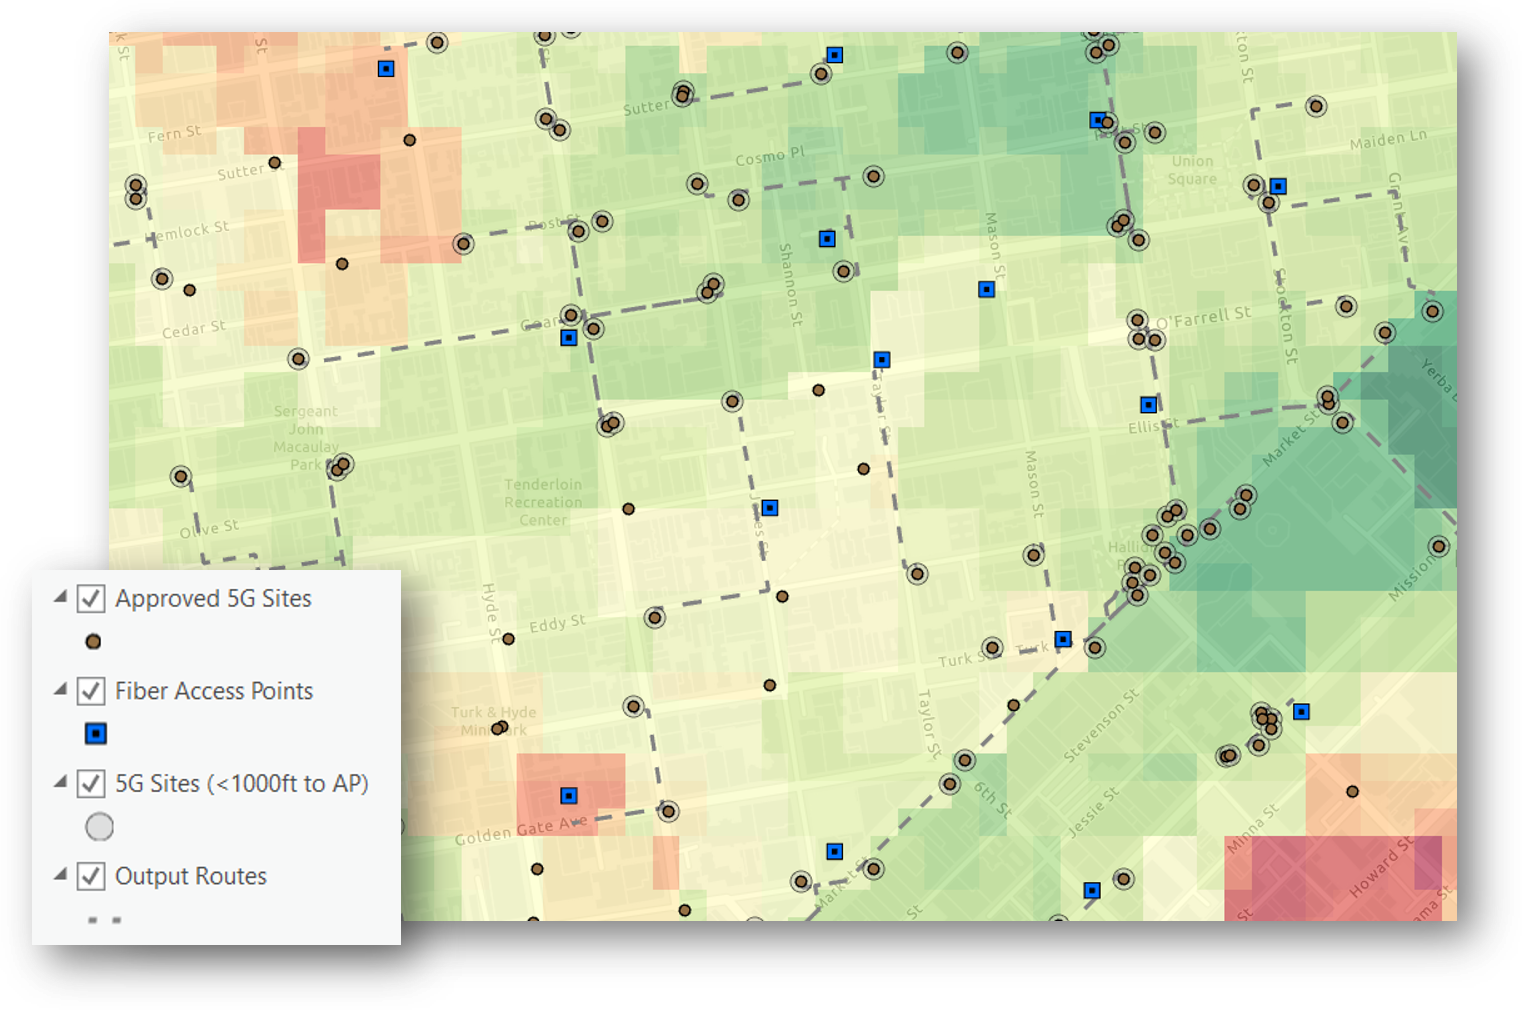
With the Closest Facility tool, quickly locate the nearest network access points to all the potential cell site locations to calculate distance and potential cost to serve that site.
Location Allocation
From all the candidate structure locations for a cell site that are near network access points, and that fall within our highly suitable areas, how do we then optimize which sites to build in order to cover the most area with the fewest number of cell sites? The Location Allocation tool within ArcGIS chooses the best location or locations from a set of input candidates, by assigning demand points to input candidates in a way that allocates the most demand to candidates and minimizes overall distance. This tool can be used to ensure new retail stores cover a certain market share or to evenly space out fire departments to ensure 4 min response times. This tool can also be used to optimize the selection of cell site candidates to ensure maximum coverage with the fewest number of sites.
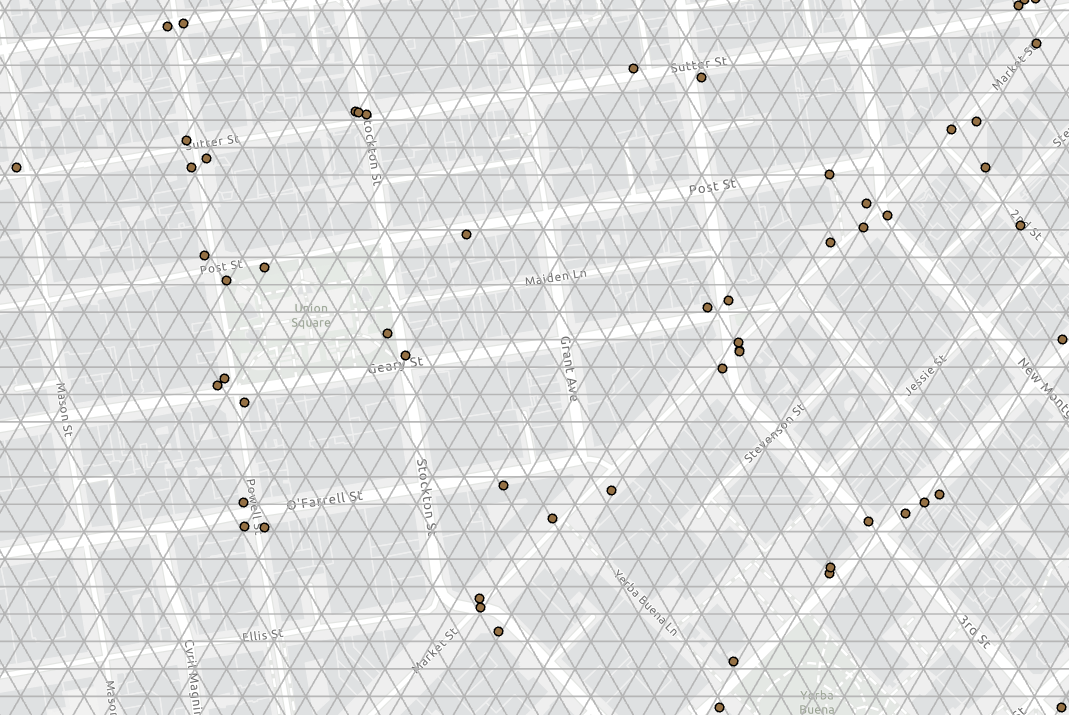
In the example graphic below, we've converted our high suitability areas to points which will become the demand points in the Location Allocation tool. This means we want to reach the demand points with the highest suitability score using the fewest number of cell sites within a specific radius of our sites.
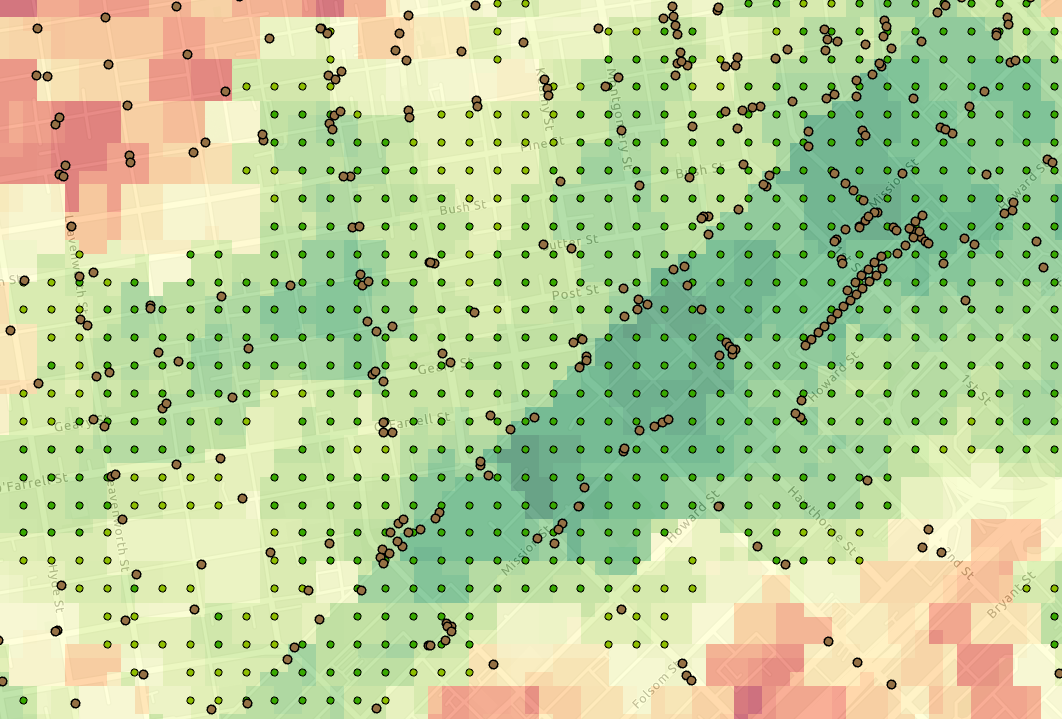
Since the the Location Allocation tool leverages a Network Dataset to calculate distance to demand points and distance between facility candidates or cell sites, we create a generic mesh network for use in the tool, shown in the graphic below.
Finally, we run the Location Allocation tool using the potential cell site locations at input facilities, the suitability points as the demand points, and our mesh network as the Network Dataset. We can also use the distance each potential cell site location is from the nearest network access point as a weight to influence the final chosen cell sites. The suitability score of our demand points is also being used as a weight to influence the final selection. And lastly, we set a distance threshold of 100 meters for a potential cell site to reach a given demand point, which is used in lieu of a RF predicted coverage area. The graphic below shows the final selection of cell sites and the top scored sites in the table.
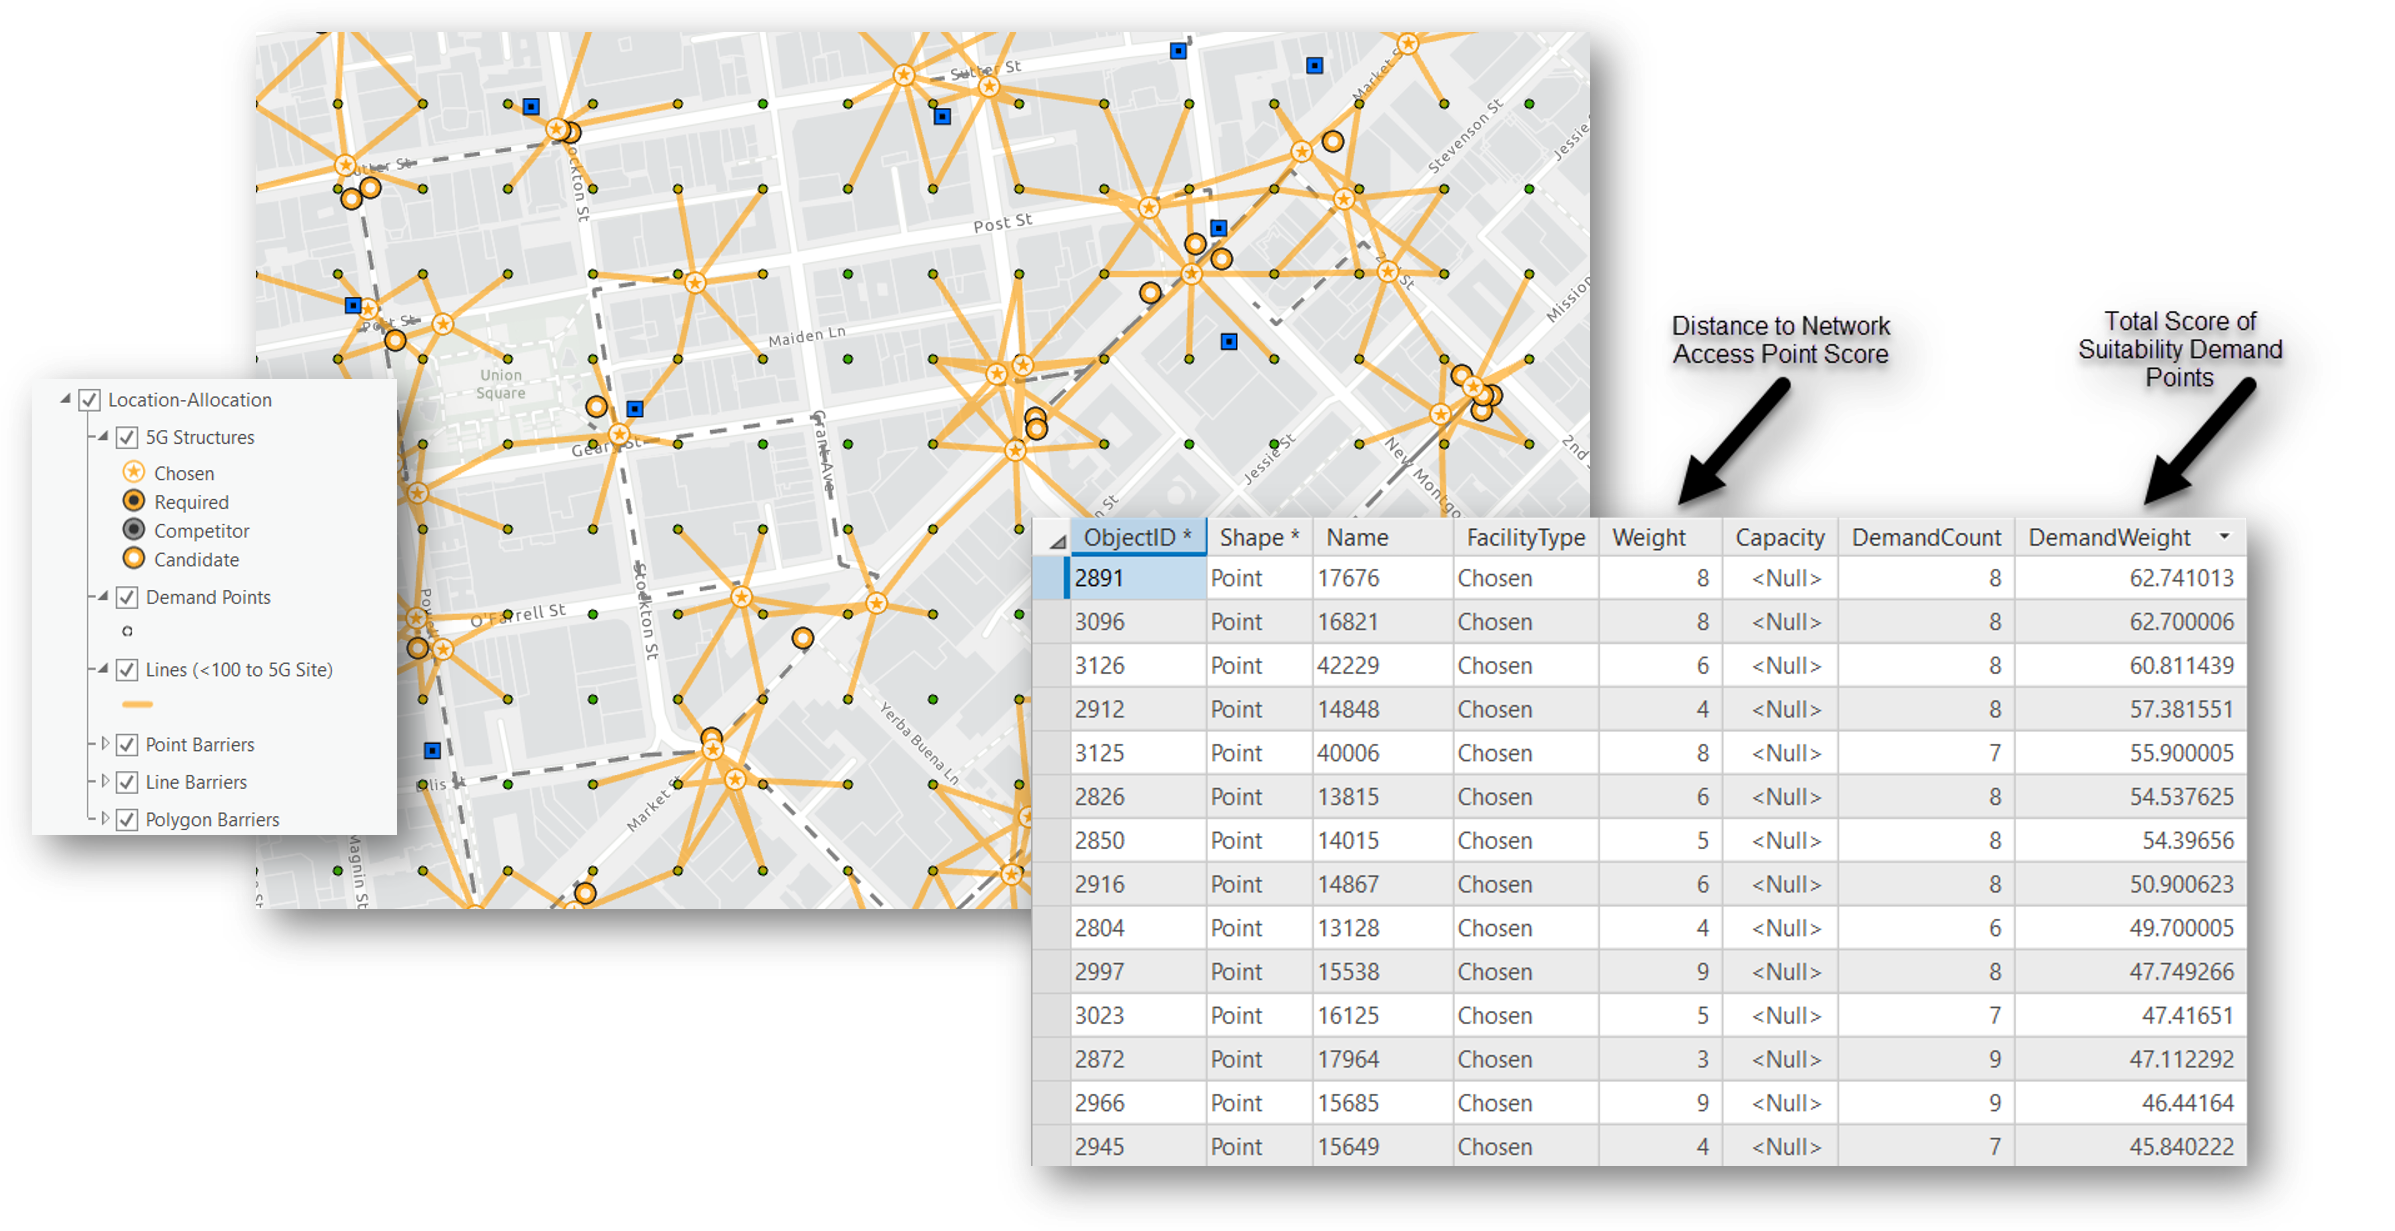
Using the the 3 ArcGIS spatial analysis tools just discussed we are able to locate areas of high suitability for cell sites. Then, from a list of potential cell site structures within those suitable areas we optimized the selection of sites based on proximity to nearest network access point and greatest coverage of the suitability demand points with fewest number of sites. Please feel free to comment or reach out to us with any questions, feedback, or ideas for improving this workflow.
Thanks,
- Esri Telecom Team
You must be a registered user to add a comment. If you've already registered, sign in. Otherwise, register and sign in.