- Home
- :
- All Communities
- :
- Industries
- :
- Public Safety
- :
- Public Safety Questions
- :
- Repeat and near repeat classification tool - visua...
- Subscribe to RSS Feed
- Mark Topic as New
- Mark Topic as Read
- Float this Topic for Current User
- Bookmark
- Subscribe
- Mute
- Printer Friendly Page
Repeat and near repeat classification tool - visualize connections feature class in 3D?
- Mark as New
- Bookmark
- Subscribe
- Mute
- Subscribe to RSS Feed
- Permalink
Repeat and near repeat classification tool (Crime analysis toolbox) creates line feature class representing relationship between repeat and near repeat incidents and their originators. I would like to visualize this in 3D but in the output of connections feature class there is no Z values from corresponding repeats/near repeats and originators. How to visualize those lines n 3D together with R/NR/originators points? Help file states that the output is Z-enabled line feature, but it is not. Thanks!
- Mark as New
- Bookmark
- Subscribe
- Mute
- Subscribe to RSS Feed
- Permalink
I reviewed the logic of Repeat and Near Repeat Classification tool, and the output lines are set to write to a feature class with Z Enabled:

The output points do write to feature class that is NOT Z Enabled, but it does write a "ZVALUE" attribute.
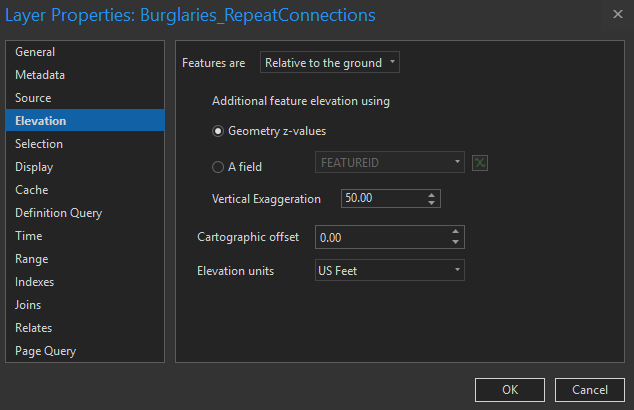
Here is an example of Elevation Layer Properties to visualize the points in a 3D scene:

Here is an example of Elevation Layer Properties to visualize the lines in a 3D scene:
With this combination you can achieve visualizations like this:

If the tool is creating output line features that are NOT Z Enabled as you've indicated then that is an unexpected behavior and we might need to take a look at the original input point data to help resolve the issue.